
A recent comment on one of our CAPE articles recently sent us digging for data on the long term perception of risk in the market. For our purposes, we're interested in risk tolerance and, specifically, the difference in yields between various forms of debt. Why is that important? Well - we could argue all day about valuations in the stock market and whether they matter in the short term to a stock investor.
On the flip side, bonds make a lot more information available to investors - and armed with historical yields we have a lot of data to look at. Let's dive in!
Historical Risk Spread Premium
These numbers aren't directly comparable - I'm using 10 year Treasury yields and S&P Index results from Robert Shiller and 30 year AAA and BAA Corporate Bond Yields from Moody's (here are their credit ratings), which target approximately 30 years of maturity. Comparing 10 year yields to ~30 year yields isn't the biggest hack in the world, but please keep it in mind while you review the results. Let's kick it off with the full chart, which is probably more useful to see gyrations than to make any conclusions:

100 Year Risk Premiums
Let me explain the 3 spreads: Baa-Aaa would be the premium demanded for buying Baa rated bonds over Aaa rated ones, and Baa/Aaa - 10Y spreads would be the premium demanded for the respective bond over the 10 Year. And, since you asked, here is the chart for just the last 20 years... so you can actually see the data (what a concept):
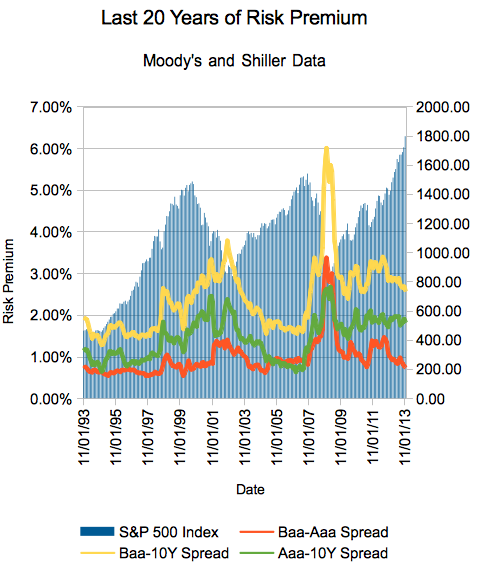
20 Year Risk Premiums
What Are We Looking At Here?
Well, the first thing you'll notice is that you'll get the most yield for your money in the scariest times - look, for example, at that spike to a 6+% risk premium for BAA corporate debt during the Great Recession. Also of note is the separation of BAA and AAA corporate debt, which also spiked over 3%. Makes sense, since the most companies will fail under stress during those times.
What else can we say about this sort of behavior? Well, other than that we haven't seen 2008 levels of fear since the Great Depression (note the 'D'), we did have some other 'rising fear' scenarios under Carter and Reagan. Of course, it's also important to call this indicator what it is - a lagging one.
Of course, we recently wrote an article about investor sentiment as measured by the AAII investor survey. In my opinion, that's what we're looking at with this particular risk spread premium - when investors are greedy, the spreads will decrease as people reach for the yield afforded by investments that are seen as too risky during the down times. Viewed from that point of view, our November data shows that investors have been increasingly reaching for yield... but not to the levels seen before the recent financial crisis.
A "fear vs. greed" indicator? Looks like it - but it's also saying that if you're somehow choosing between AAA and BAA corporate debt versus 10 Year Treasuries, your best bet historically is the AAA in this environment - yields compared to the 10 Year are high, and the spread between BAA and AAA isn't enticing. This is, of course, to say nothing about absolute yields (which is low - but inflation expectations are low too, remember). Anyway, that's why we do these think pieces - to find the story behind the story. And in this era of low absolute yields, relative yields are... well, acting somewhat normally.
If you want to use this information to shape your upcoming decisions, here's the statistics on this data:
| Baa-Aaa Spread | Baa-10Y Spread | Aaa-10Y Spread | |
| Average | 1.20% | 2.03% | 0.83% |
| Standard Deviation | 0.71% | 1.01% | 0.53% |
| Maximum | 5.64% | 7.47% | 2.68% |
| Minimum | 0.32% | 0.29% | -0.17% |
| November 2013 | 0.75% | 2.58% | 1.83% |
And the November 2013 readings? AAA - 4.63%, BAA - 5.38%, 10Y - 2.8% (it was 2.88% as of Friday, 12/13).
Here's our related calculator on reinvested 10 Year Treasury returns - we don't yet have one for reinvested corporate debt, but if you ask nicely... 'tis the season!
