
The average American household carried a $2,768 credit card balance in 2023. That debt was concentrated, however – the median household carried $0 balance cycle to cycle, while the top 10% of households by credit card debt had $8,000 in credit card debt.
54.78% of households held no credit card debt balance from month to month (at least, at the time they were surveyed).
Credit Card Debt Statistics in America
Americans spend a lot on their credit cards. The New York Federal Reserve reports on the makeup of household debts and assets every quarter – unfortunately, only in large aggregate groups.
In the most recent refresh, households carried $1.079 trillion in credit card debt as a group. 9.43% of that debt was 90 or more days delinquent – that's on top of a standard monthly credit card cycle.
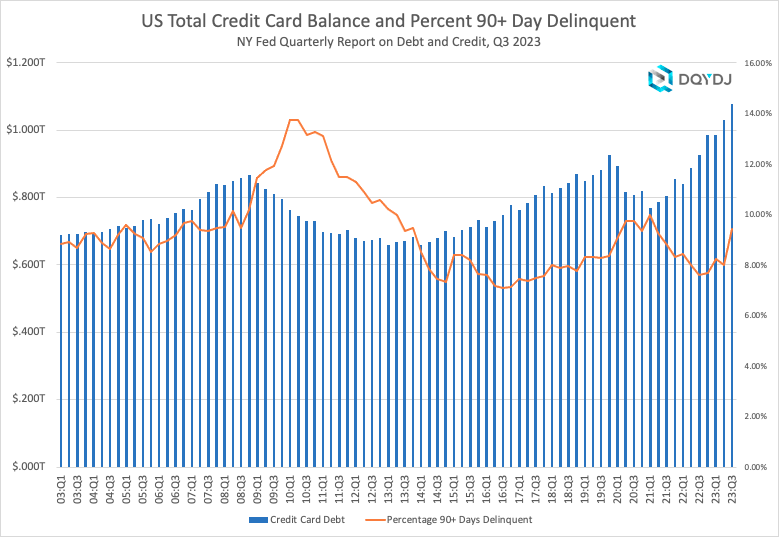
For the first time since the early pandemic, we saw a large spike in delinquent credit card debt (from 8% to 9.43% of outstanding credit card debt) and overall credit card debt (from $1.031 trillion to $1.079 trillion). However, as you can see, the data isn't necessarily predictive. Credit card debt, as opposed to other debt types, tends to decrease as a recession ends... including decreasing after the early pandemic-driven recession.
Credit Card Debt Statistics by Percentile
As I mentioned above, not every household carries a credit card balance from month to month a slight majority of households do not. Here's how credit card debt broke down by percentile in 2023:
| Household Credit Card Debt Percentile | Credit Card Debt |
| 10% | 0 |
| 20% | 0 |
| 30% | 0 |
| 40% | 0 |
| 50% | 0 |
| 60% | $300 |
| 70% | $1,250 |
| 80% | $3,300 |
| 90% | $8,000 |
The number listed is the minimum breakpoint which puts a household in a credit card debt bracket. For example, a household with $7,999 in credit card debt would be between the 80th and 90th credit card debt deciles... though, we can assume, in the 89th percentile of credit card debtors.
Credit Card Debt by Generation
Generations use their credit cards differently… and credit habits evolve as you age. Here's a more interesting breakdown that groups people into their generation – Millennials to the Greatest Generation.
We'll have to wait on the next SCF (late 2022) for younger folks, but here's the 2019 breakdown:
| Generation | Average | 25th Percentile | Median | 75th Percentile | Percentage with CC Debt |
| Millennial | $2,918 | $0.00 | $120 | $2,700 | 42.47% |
| Generation X | $3,716 | $0.00 | $240 | $3,500 | 53.95% |
| Baby Boomer | $2,582 | $0.00 | $0.00 | $1,400 | 37.22% |
| Silent | $1,017 | $0.00 | $0.00 | $200.00 | 28.66% |
And here's the division of generations:
- Millennial (26-40 years old, approximately born 1982-1996)
- Gen X (41-57, approximately born 1965-1981)
- Baby Boomer (58-77, approximately born 1945-1964)
- Silent (78-94, approximately born 1928-1944)
Credit Card Debt by Income Bracket
Also always interesting: debt by income bracket. Just as peoples' risk tolerance changes by age and situation, different income brackets show different credit card habits.
This table summarizes various income percentiles and shows the median, 25th, and 75th percentile of credit card debt (and the average) for US households in 2019:
| Income Bracket | 25% | 50% | 75% | Average |
| 0-9.9 | $0 | $0 | $170 | $1,050 |
| 10-19.9 | $0 | $0 | $700 | $1,379 |
| 20-29.9 | $0 | $40 | $1,600 | $1,783 |
| 30-39.9 | $0 | $0 | $900 | $1,780 |
| 40-49.9 | $0 | $200 | $2,500 | $2,926 |
| 50-59.9 | $0 | $500 | $3,430 | $3,843 |
| 60-69.9 | $0 | $700 | $4,150 | $4,022 |
| 70-79.9 | $0 | $30 | $4,000 | $4,067 |
| 80-89.9 | $0 | $0 | $4,000 | $3,974 |
| 90-94.9 | $0 | $0 | $1,800 | $3,066 |
| 95-98.9 | $0 | $0 | $0 | $2,510 |
| 99-100 | $0 | $0 | $0 | $3,158 |
Credit Card Debt in America Methodology
This posts' stats – unless otherwise credited – are sourced from the Federal Reserve SCF's 2022 survey.
One picky note: technically we're looking at PEUs or Primary Economic Units, not households:
"...the PEU consists of an economically dominant single individual or couple (married or living as partners) in a household and all other individuals in the household who are financially interdependent with that individual or couple. For example, in the case of a household composed of a married couple who own their home, a minor child, a dependent adult child, and a financially independent parent of one of the members of the couple, the PEU would be the couple and the two children."
Federal Reserve SCF Data Codebook, 2022
Other debt posts
I've posted research on American debt, along with data on specific debt types. Here are other posts you might enjoy:
Past editions
Here are the past studies on credit card debt, coinciding with previous SCFs:
