
Today, let's take a look at the last 12 years of the dividend reinvested S&P 500 mashed up with the Consumer Price Index. This should show you the actual* investment returns on that index.
*(You know, setting aside taxes, fees, and your own varied cost of living.)
Inflation and Dividend Adjusted S&P 500 Closing Prices
Last 12 Years: Inflation and Dividend Adjusted S&P 500 Closing Price
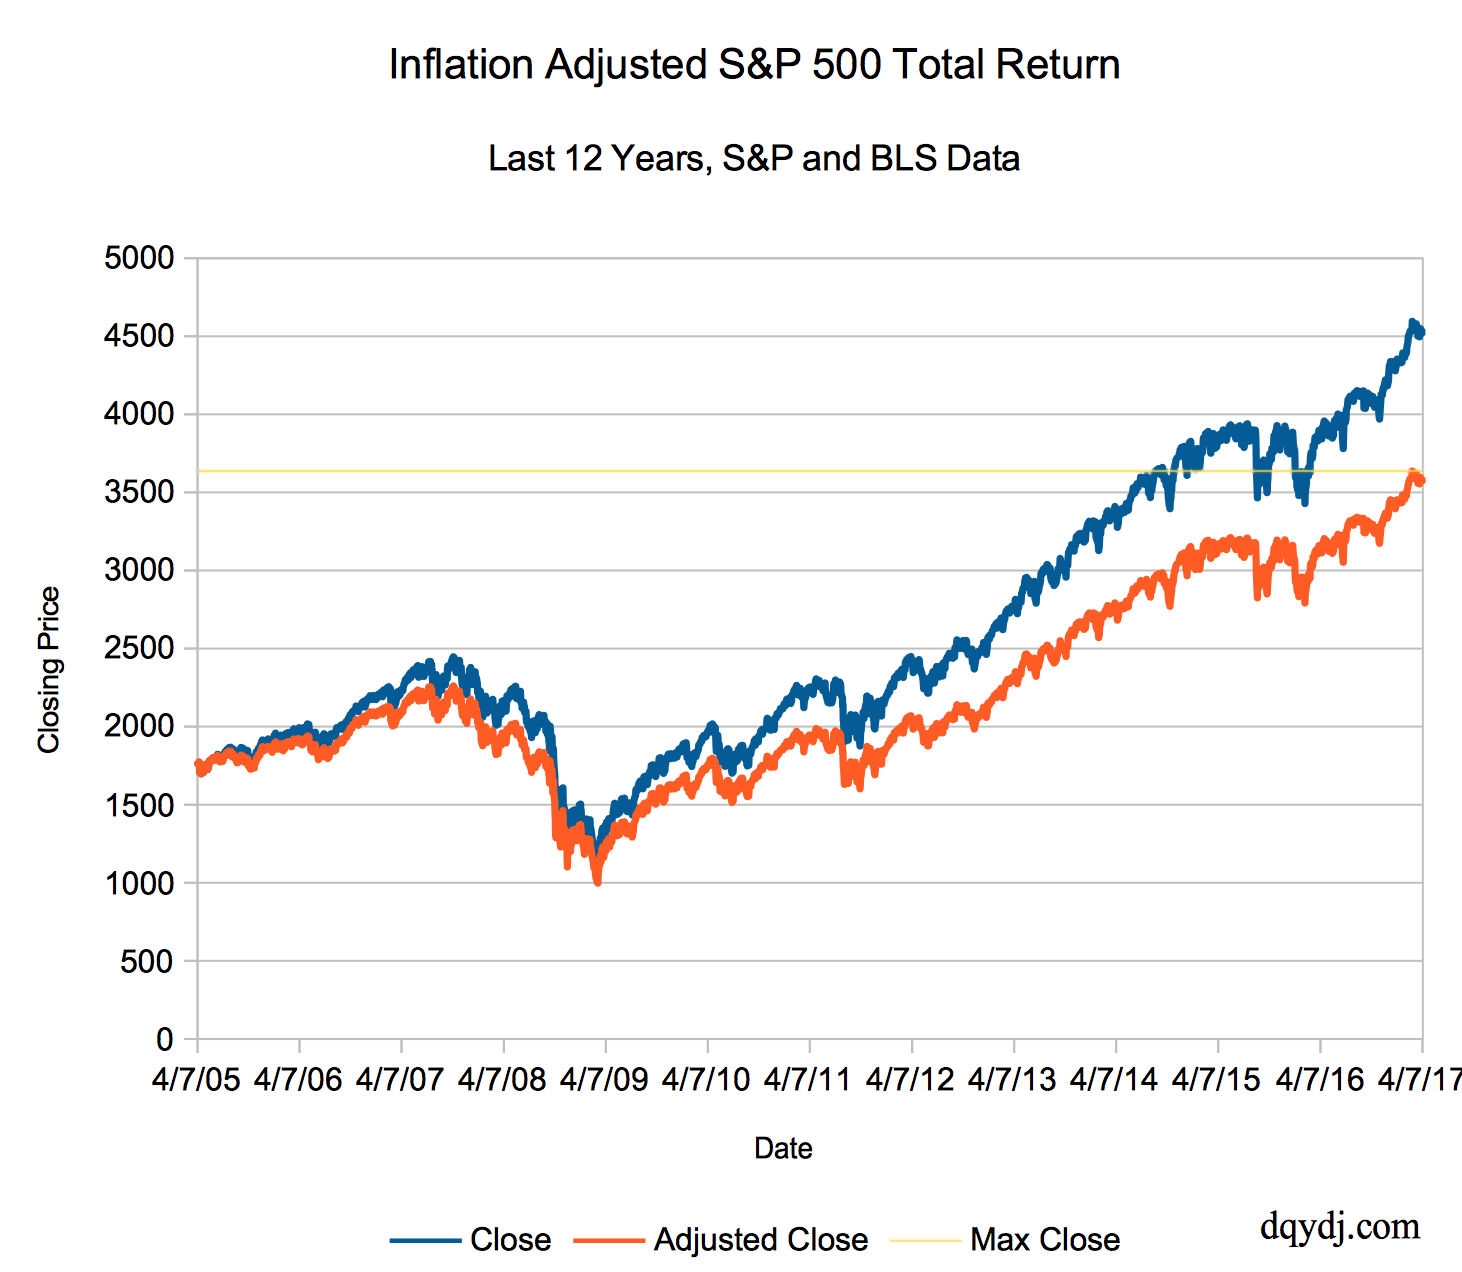
Above we've graphed the last 12 years of S&P 500 closing prices, including reinvested dividends.
The orange line is the S&P 500 Total Return Index. Put out by S&P Dow Jones Indices, the SPTR tracks dividend payments and assumes automatic readjustment. Although it doesn't factor in taxes, fees, slippage, or delays amongst other real life problems, looking at returns which attempt to factor in dividends is superior to just a price index. (On that note, try our S&P 500 Total Return calculator with monthly resolution).
The blue line is the inflation adjusted S&P 500 Total Return Index. We've taken the CPI-U from the Bureau of Labor Statistics (retrieved 4/9/2017, data through Feb. 2017) and adjusted the closing prices. We used linear interpolation for the daily inflation readings, with extrapolation from January and February data for the last few months.
The maximum inflation and dividend adjusted closing high in our data is the pale yellow line.
When Was the Last Real Closing High?
By this methodology, the last S&P 500 closing high was on 3/1/2017 - almost a month and a half ago. By this same math, we're only around 1.63% below that point.
This has been quite a long bull market, and we won't continue racking up huge gains forever - but two to three months does not an investing career make! Set your portfolio up for whatever eventualities may come. You don't want to be panic selling into a dip or buying in response to huge gains. Find yourself a mix that you're comfortable with no matter where we go from here.
Pep talks aside, let us know what you're doing in the current market environment... what's your asset class mix? Are you prepared for any market, up down or sideways?
