
Ever wonder how career income changes - as a worker gets older and more experience, how their income curve works? Wondered how a new worker's salary and income change will look after working a few years - or an entire career?
Sure you have - we surely did, and we can tell you that articles like our net worth by age and income by age calculators (actually, the savings rate by age one too) get more than a fair share of views. The limit of those articles, of course, is that they are a snapshot of conditions at a single time.
We were inspired by Economist Guillermo Dominguez's tweet about the path of median incomes over time. He took 25-34 year old median incomes and followed median income observations over the years - in effect, turning snapshots into longitudinal data. (Dominguez has a website here you should subscribe to, and you should of course follow him on Twitter.) We do something similar with IPUMS-CPS data from 1992-2014, treating income brackets as 'individuals' and following their career.
What is a 25 Year Old's Career Income Path?
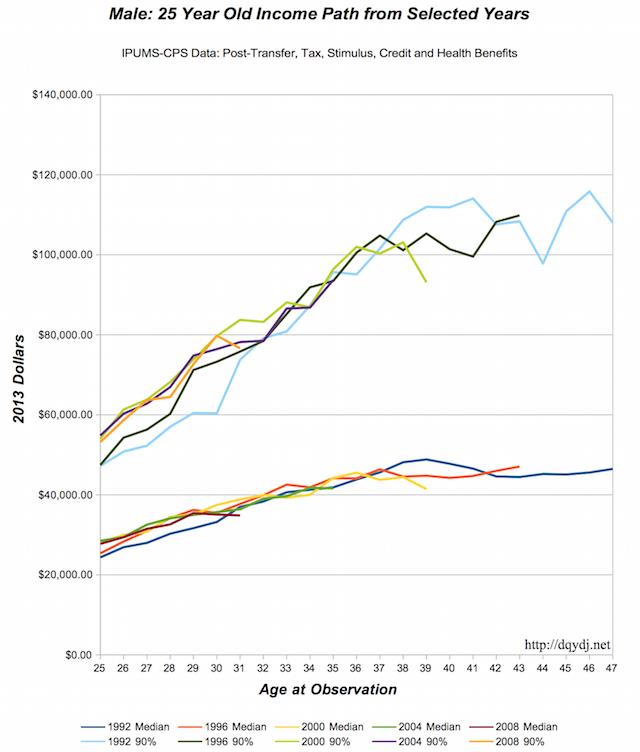
First up, how 25 year old males in 1992, 1996, 2000, 2004, and 2008 fared over the courses of their careers (all dollar amounts CPI adjusted to 2013 dollars). Of course, all five of our theoretical males are still in their careers (it's only 23 years of data), but it lets us see exactly how he career paths for our young charges evolve... and are evolving, for the newer ones... over time. We pick both the median income for each age in the yearly evaluations, then add a worker in the 90th percentile of resources.
Here's how it looks:
And now, for females who started in the same years:
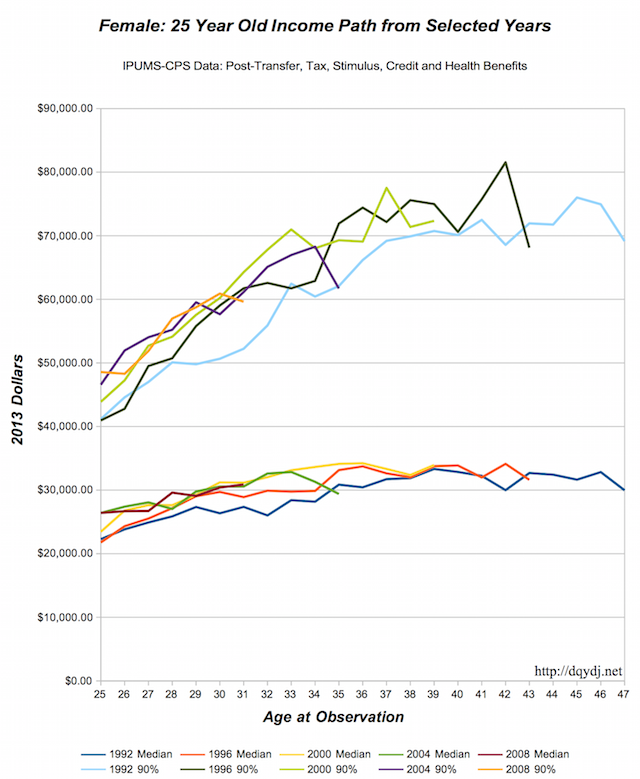
Note that the year is observation year - so the income would be from the year before. (This data is from March, during tax season - so the 1992 survey would be asking about 1991 income, for example.)
We followed Dominguez's basic methodology, but we wanted to use total resources instead of income. Total Resources is a harder value to figure out, so we had to synthesize it and make a few judgement calls - but you can find some background on household resource calculations from the Census Bureau, which (now, just in the last few years!) attempts to adjust for total resources when calculating the poverty rate in America. It's the right thing to do - consider that your true spending power isn't your pre-taxed income, it's what you have left after tax, plus whatever in-kind benefits you receive. (Say you were given a free house, but lost 1% of your income - for most of us, you're way better off with the house.)
We, on the other hand, are concerned with individual incomes... and (of course) extending the series back in time before the Census Bureau kindly did the math for us. Please read our more detailed methodology below if you're interested in the inner workings, but our basic calculation is this:
Income - Income from Child Payments - Payroll, State, and Federal Taxes + Tax Credits & Stimulus Programs + Government Transfer Programs and Benefits (Food Stamps, Reduced/Free School Lunch, Energy Subsidies, ) + Government Health Benefits + Employer Health Benefits
Sources
Miriam King, Steven Ruggles, J. Trent Alexander, Sarah Flood, Katie Genadek, Matthew B. Schroeder, Brandon Trampe, and Rebecca Vick. Integrated Public Use Microdata Series, Current Population Survey: Version 3.0. [Machine-readable database]. Minneapolis: University of Minnesota, 2010.
Larrimore, Jeff, Richard V. Burkhauser, Shuaizhang Feng, and Laura Zayatz. "Consistent Cell Means for Topcoded Incomes in the Public Use March CPS (1976-2007)". Journal of Economic and Social Measurement 33(2/3): 89-128
Census Bureau revised income topcode files, accessed 5/13/2015.
Methodology on Career Income Change
We roughly based our calculation off the Census's Bureau's methodology for calculating it for households, linked above. Here's a snapshot of how they do it, and we did our best to match it:
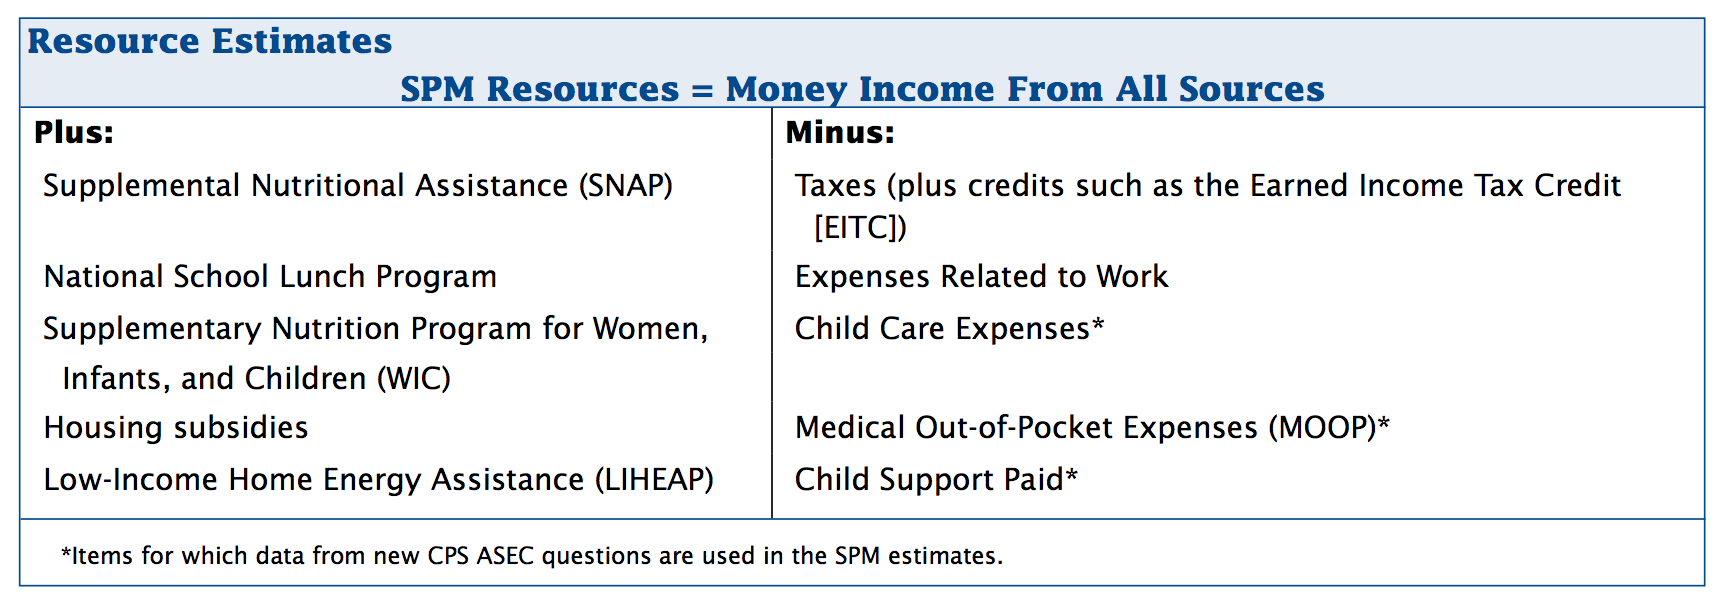
Because these calculations only start in 2010, we did our best to stretch backwards. That said, we're missing two major category of benefits (housing - give me a few grad students and I'll knock it out) and military health benefits (note the limitations of CPS data when factoring in the military), and a few smaller (in dollar value) ones: things like the Indian Health Service, and SCHIP. I'm sure there are many others, but let me know if there are any huge ones with easy data that we can model in any future revisits!
I'll start with medical benefits. Since we couldn't do out of pocket medical spending, we assumed that everyone spends on medicine and added Medicare, medicaid, and Private health care contributions from employers to our resources. Note that means we're leaving out the numbers from above - and any health benefits for children other than private health contributions. (Which are, weirdly enough, top-coded at $9,999 - so multiple person plans will hit that limit reasonably quickly.) Medicare data from before 2004 are synthesized from health insurance unit Medicare benefit value divided by the number of people in the health insurance unit. I took the 2004 maximum individual Medicare benefit value and inflation adjusted it backwards, setting that as my topcode.
Government benefits were more straightforward, but we did synthesize free and reduced school lunch benefit values using the methodology described in the Census paper. All benefits were divided amongst the members of each household over age 18, so there was no double counting.
Taxes, credits, and stimulus data come from a model called TaxSim and are already based on individuals - I did a bit of reading on TaxSim here, but no adjustments were made.
For income, there is no "child support paid" value for older surveys, so I instead just subtracted it from income so it wouldn't be double counted. This is the income variable we started with, see if you can find your favorite form of income in there.
If you're still with me, here's the massaged csv (about 2300 lines x 20 columns, so open it with a reasonably new machine, not your phone) :
Author's note: I was going to post my fully massaged data from R, but it's 700 MB unfortunately - a single CD, sure, but a significant chunk of my hosting. If you truly would use it let me know if you can think of a good place to stash it. Hopefully the csv will suffice for now.
Career Income Change: The Conclusion
You can clearly see, inflation adjusted, how different generations have fared in the workforce, and make predictions on how generations will perform, income change wise, in the coming years.
Also, note the flattening of income in the late 30s to mid 40s, seen especially prominently in our 90% males and females. That age is very interesting in personal finance - we called out 38 years old as being when the average person's savings start to dominate their current income as the biggest factor in his or her net worth. We also talked about how the mid to late 40s is when men and women are at the top of their financial game. It's very interesting to see these ages crop up again and again with this important data. Let us know (in the comments, preferably!) if you have any theories - income and substitution effects, perhaps?
