
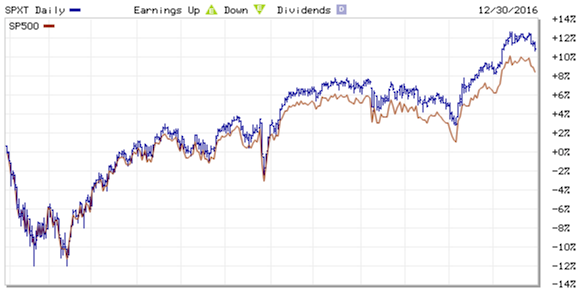
The S&P 500 Price index returned 9.84% in 2016 - and that is the number you'll see quoted most often in the press. However, a more extensive calculation including dividends reveals that the true 2016 S&P 500 return was roughly 12.25%.
Including Dividend Reinvestment is the Key to True Return Comparisons on the S&P 500
We know... if you've been following us for a while, we tend to beat the dividend reinvestment drum quite a bit. For the vast majority of investors (if not 100%) it's the actual benchmark to check against.
Although dividend timing, fees, slippage, taxes and other factors will cause individual returns to vary from the 12.25% number quoted, it's a closer approximation than price returns. Assuming price returns are accurate is also assuming that investors in some way discard their dividends. Unless investors are using burning dividend checks to heat their houses, this can't be accurate.
We get these numbers from S&P Dow Jones Indices, the owner of the S&P 500. They estimate the effect of immediately reinvesting dividend payments of S&P 500 companies in the index.
Although DQYDJ doesn't have calculators with daily resolution, we have built some tools to look at monthly total returns and the S&P 500:
- S&P 500 Dividend Reinvestment Calculator
What would a lump sum purchase in a month have returned in some time period? - S&P 500 Periodic Reinvestment and Dividend Calculator
Possibly assuming some taxes and fees as well as additional investment, what's a good estimate of a period's returns? - S&P 500 Historical Return Calculator
Aggregating all time periods in the data set, what returns and variance have we seen in the past over those periods? - CAPE Calculator
A calculator which computes the Cyclically Adjusted Price to Earnings Ratio on the S&P for your choice of time period (default: ten years).
The 2016 S&P 500 Return
2016 S&P 500 Return and Total Return
Simply including some accounting for dividends was the difference between a 'single digit' and a 10+% return on the S&P 500. Make sure you use the right one when you're benchmarking your own portfolios (and be sure to account for your own dividends!).
Here are the exact numbers for the S&P 500 in 2016. We used the opening price on 1/4/2016 and the closing price on 12/30/2016 for these calculations. (Ed: As pointed out by Sagitta in the comments, another methodology would be to use the close price last year as the start point - in that case you'd be looking at ~ 11.96% gain).
| 01/04/2016 Open | 12/31/2016 Close | Annual Return | |
| S&P 500 Total Return | 3811.74 | 4278.67 | 12.25% |
| S&P 500 Index | 2038.20 | 2238.83 | 9.84% |
See other S&P 500 annual returns:
- 2023 S&P 500 Return
- 2022 S&P 500 Return
- 2021 S&P 500 Return
- 2020 S&P 500 Return
- 2019 S&P 500 Return
- 2018 S&P 500 Return
- 2017 S&P 500 Return
- 2015 S&P 500 Return
- 2014 S&P 500 Return
- 2013 S&P 500 Return
- 2012 S&P 500 Return
Where do you see the S&P 500 going in 2017? Will it do as well as in 2016?
