
The S&P 500 Price index returned 23.79% in 2023. Using a better calculation which includes dividend reinvestment, the S&P 500 returned 25.83%.
The 2023 S&P 500 Return: Revenge on 2022
For the calculation I did above, I assumed you bought the open price of the S&P 500 on January 3, 2023, and sold the close price on December 29, 2023. For various reasons, that is impossible – however, it's my best take on investing 'all in one year'.
If you instead are searching for a one-year span, those numbers look like a 24.23% and 26.29% gain, respectively. That calculation instead assumes you bought the December 30, 2022 close.
Either way? The index did well, and cancelled out losses it had in 2021. Well, almost, at least according to price level – the S&P 500 opened on January 3, 2021 at 4,778.14. You did, however, make a nominal gain if you reinvested dividends (I link past editions of this post below).
S&P 500 Index Price Calculation
| Price Based On | 2023 Begin | Dec 29 Close | Return |
| Jan 3 Open | 3,853.29 | 4,769.83 | 23.79% |
| Dec 30 Close | 3,839.50 | 4,769.83 | 24.23% |
S&P 500 Total Return Price Calculation
| Price Based On | 2023 Begin | Dec 29 Close | Return |
| Jan 3 Open | 8,207.69 | 10,327.83 | 25.83% |
| Dec 30 Close | 8,178.02 | 10,327.83 | 26.29% |
Dividends Matter
The exact date you pick doesn't much matter... as long as you keep your timeframes consistent. (However, you do need to mind the dividends!)
It was a very weak year for equity returns in the United States. Coming off the stimulative environment (or excesses, as some would argue...) of the early COVID Pandemic, stocks fell as Federal reserves across the world increased rates and sold assets (or allowed assets to roll off their balance sheets). However, when you consider dividend reinvestment, your returns "didn't look as bad."
Yes, they were still weak. But including dividends is an important consideration.
Source on the 2023 S&P 500 Return Calculations
S&P Dow Jones Indices owns the S&P 500 Index and its total return index. They added the total return index in 1987. Before then, you have to construct your own index proxy to see how the index has fared.
We have a collection of investing calculators and tools – most including provisions for dividend, coupon, or interest reinvestment. Here are some which highlight the S&P 500:
- S&P 500 Dividend Reinvestment Calculator
Dividend reinvestment calculations on the S&P 500 back as far as we can cover them – 1871, as of now - S&P 500 Periodic Reinvestment and Dividend Calculator
A tool which additionally tries to estimate fees and taxes. Allows periodic scheduled additions to investments. - S&P 500 Historical Return Calculator
See the average, median, best, and worst returns on the S&P 500 over a time period.
The 2023 S&P 500 Return
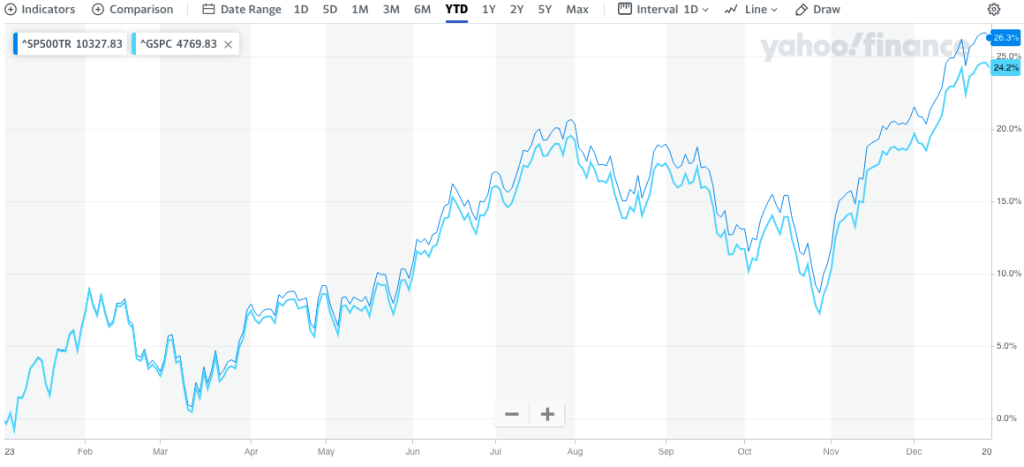
You can quickly find the S&P 500 and Total Return index at Yahoo!. Here's a graph showing the difference in the indices in 2023:
Other years:
