
On this page are estimated United States net worth brackets for 2026. (The newest data we'll have until 2029.)
Here you'll see average net worth, median net worth, top 1% net worth, and a comparison with the previous net worth data.
Net worth benchmarks in 2026
Just as with household income, the most important net worth statistics are:
- Median net worth
- Average net worth
- Top 1% net worth
Of these, median net worth is the most important statistic.
Although average net worth is higher than median (at $1,231,997 vs. $215,916, respectively), median is the 'middle point' of wealth. That is, half of households in the United States have more net worth, and half less – average is biased by high net worth households dragging the average upwards.
The numbers in these sections are nominal – they are not adjusted for inflation (later sections are, however).
Note: This data comes from the Federal Reserve SCF, released October 2026. It comes from interviews mainly conducted in 2025. About one-seventh of interviews were conducted in early 2026.
What was the median net worth?
In 2026, $215,916 was the median household net worth in the United States. This is up from $192,084 in 2023 (before inflation adjustments).
What was the average net worth?
The average household net worth in 2026 was $1,231,997. It was $1,059,470 in 2023 (before inflation adjustments). See the inflation adjustment, below.
What is the top 1% household net worth?
To be top 1% in 2026, a household needed a net worth of $16,463,320. $13,666,778 was the 1% threshold in 2023 (before inflation adjustments).
What is the top .5% net worth? What is the top .1% household net worth?
To be top .5% in 2026, a household needed a net worth of $22,930,532. The top .1% bracket started around $63,821,752.
Note: up here, net worth estimates have a much larger error. Using the Fed's replicate weights, one standard error is roughly +/- $4.7 million for the .1% bracket (and only ~ +/- $1 million for the top 1%). And that only counts sampling and imputation error – it doesn't factor in who chooses to answer the survey, or who doesn't.
At the upper percentiles, there is less survey data to inform the stats (although with the SCF it's not bad – the survey does oversample likely high-wealth households). The SCF is the gold standard survey for measuring net worth, and the oversample is part of the reason why.
Selected United States household net worth percentiles for 2026 and 2023
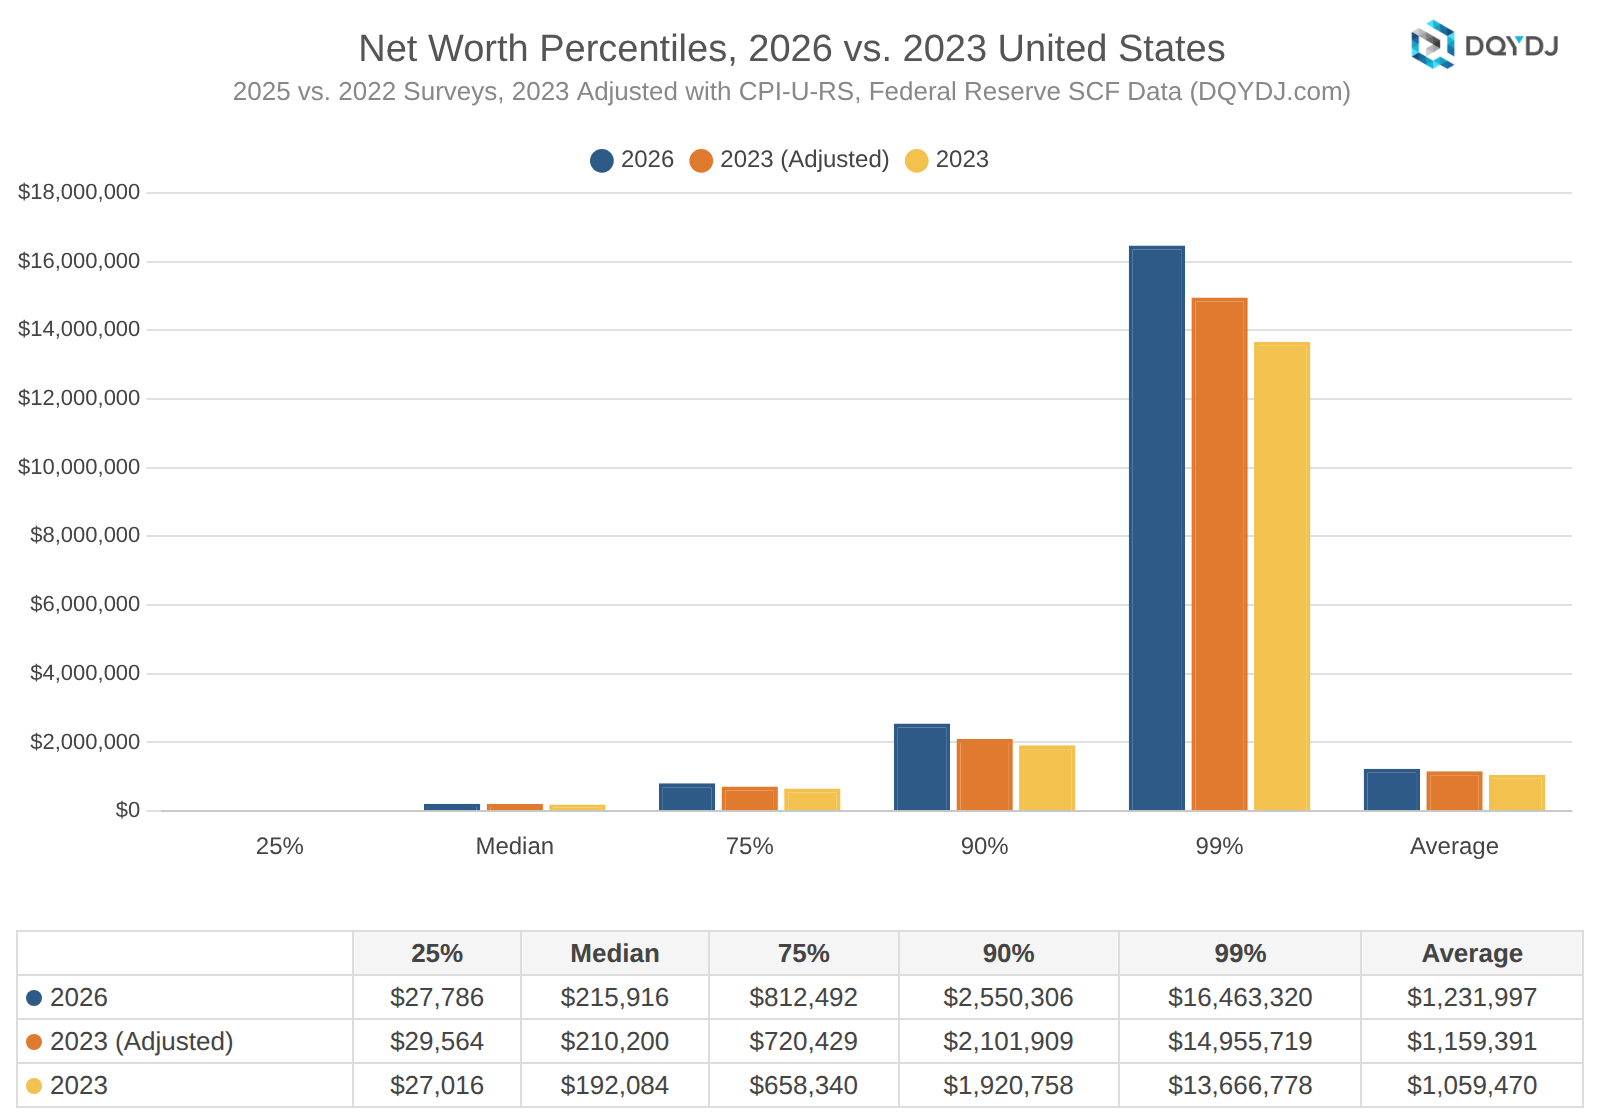
The most recent data is adjusted for CPI-U-RS [PDF] as detailed by the Fed. To do the inflation math versus the previous data, multiply 2023 dollar amounts by 1.0943.
Household net worth percentiles for the United States in 2026
Below is every household net worth percentile in 2026, compared to inflation-adjusted 2023.
| Percentile | 2026 | 2023 (adjusted) | Difference | Change |
| 1% | -$71,262 | -$83,684 | $12,422 | |
| 2% | -$39,680 | -$49,712 | $10,033 | |
| 3% | -$26,884 | -$28,945 | $2,061 | |
| 4% | -$14,494 | -$16,396 | $1,902 | |
| 5% | -$8,806 | -$10,810 | $2,004 | |
| 6% | -$4,142 | -$4,794 | $653 | |
| 7% | -$1,632 | -$910 | -$722 | |
| 8% | -$86 | $1 | -$87 | |
| 9% | $29 | $199 | -$170 | -85.46% |
| 10% | $225 | $482 | -$257 | -53.29% |
| 11% | $720 | $1,084 | -$364 | -33.55% |
| 12% | $1,328 | $2,793 | -$1,465 | -52.45% |
| 13% | $2,166 | $4,439 | -$2,273 | -51.20% |
| 14% | $3,740 | $5,699 | -$1,959 | -34.38% |
| 15% | $5,052 | $7,148 | -$2,096 | -29.33% |
| 16% | $6,420 | $8,455 | -$2,035 | -24.07% |
| 17% | $7,734 | $10,129 | -$2,395 | -23.64% |
| 18% | $9,246 | $11,348 | -$2,102 | -18.53% |
| 19% | $10,862 | $12,924 | -$2,062 | -15.95% |
| 20% | $13,216 | $14,804 | -$1,588 | -10.73% |
| 21% | $15,454 | $17,071 | -$1,617 | -9.47% |
| 22% | $17,504 | $19,722 | -$2,218 | -11.25% |
| 23% | $20,932 | $22,670 | -$1,738 | -7.67% |
| 24% | $24,620 | $25,508 | -$888 | -3.48% |
| 25% | $27,786 | $29,564 | -$1,778 | -6.01% |
| 26% | $31,970 | $33,175 | -$1,205 | -3.63% |
| 27% | $37,986 | $37,471 | $515 | 1.37% |
| 28% | $43,003 | $43,155 | -$152 | -0.35% |
| 29% | $49,397 | $48,953 | $444 | 0.91% |
| 30% | $55,384 | $56,210 | -$826 | -1.47% |
| 31% | $60,678 | $62,420 | -$1,742 | -2.79% |
| 32% | $66,704 | $68,504 | -$1,800 | -2.63% |
| 33% | $72,136 | $73,866 | -$1,730 | -2.34% |
| 34% | $77,222 | $80,016 | -$2,794 | -3.49% |
| 35% | $82,258 | $86,510 | -$4,252 | -4.91% |
| 36% | $88,503 | $92,202 | -$3,699 | -4.01% |
| 37% | $97,319 | $97,978 | -$659 | -0.67% |
| 38% | $103,802 | $105,627 | -$1,825 | -1.73% |
| 39% | $111,049 | $111,580 | -$531 | -0.48% |
| 40% | $120,570 | $120,718 | -$148 | -0.12% |
| 41% | $130,010 | $128,921 | $1,089 | 0.84% |
| 42% | $138,610 | $137,540 | $1,070 | 0.78% |
| 43% | $145,804 | $145,141 | $663 | 0.46% |
| 44% | $155,538 | $154,477 | $1,061 | 0.69% |
| 45% | $165,090 | $161,210 | $3,880 | 2.41% |
| 46% | $178,466 | $170,612 | $7,854 | 4.60% |
| 47% | $188,120 | $179,612 | $8,508 | 4.74% |
| 48% | $199,026 | $188,406 | $10,620 | 5.64% |
| 49% | $207,402 | $198,685 | $8,717 | 4.39% |
| 50% | $215,916 | $210,200 | $5,716 | 2.72% |
| 51% | $225,586 | $221,167 | $4,419 | 2.00% |
| 52% | $236,220 | $232,609 | $3,611 | 1.55% |
| 53% | $248,582 | $244,638 | $3,944 | 1.61% |
| 54% | $260,332 | $260,483 | -$151 | -0.06% |
| 55% | $272,680 | $273,994 | -$1,314 | -0.48% |
| 56% | $283,202 | $286,320 | -$3,118 | -1.09% |
| 57% | $298,134 | $300,875 | -$2,741 | -0.91% |
| 58% | $312,562 | $315,834 | -$3,272 | -1.04% |
| 59% | $328,324 | $327,072 | $1,252 | 0.38% |
| 60% | $346,360 | $342,106 | $4,254 | 1.24% |
| 61% | $367,666 | $358,521 | $9,146 | 2.55% |
| 62% | $393,094 | $380,295 | $12,799 | 3.37% |
| 63% | $412,390 | $401,008 | $11,382 | 2.84% |
| 64% | $429,810 | $421,212 | $8,598 | 2.04% |
| 65% | $448,456 | $440,789 | $7,667 | 1.74% |
| 66% | $475,970 | $454,643 | $21,327 | 4.69% |
| 67% | $500,328 | $469,668 | $30,660 | 6.53% |
| 68% | $534,796 | $490,206 | $44,590 | 9.10% |
| 69% | $568,682 | $512,449 | $56,233 | 10.97% |
| 70% | $597,046 | $539,570 | $57,476 | 10.65% |
| 71% | $627,620 | $570,137 | $57,483 | 10.08% |
| 72% | $666,884 | $604,047 | $62,837 | 10.40% |
| 73% | $711,838 | $643,420 | $68,418 | 10.63% |
| 74% | $761,250 | $681,260 | $79,990 | 11.74% |
| 75% | $812,492 | $720,429 | $92,063 | 12.78% |
| 76% | $868,740 | $763,366 | $105,374 | 13.80% |
| 77% | $920,960 | $813,691 | $107,269 | 13.18% |
| 78% | $970,608 | $859,565 | $111,043 | 12.92% |
| 79% | $1,031,844 | $915,878 | $115,966 | 12.66% |
| 80% | $1,084,972 | $975,853 | $109,119 | 11.18% |
| 81% | $1,153,922 | $1,036,809 | $117,113 | 11.30% |
| 82% | $1,231,286 | $1,105,102 | $126,184 | 11.42% |
| 83% | $1,302,406 | $1,179,990 | $122,416 | 10.37% |
| 84% | $1,391,057 | $1,263,530 | $127,527 | 10.09% |
| 85% | $1,502,940 | $1,351,309 | $151,631 | 11.22% |
| 86% | $1,663,620 | $1,431,826 | $231,794 | 16.19% |
| 87% | $1,847,490 | $1,531,308 | $316,182 | 20.65% |
| 88% | $2,021,180 | $1,653,442 | $367,738 | 22.24% |
| 89% | $2,325,686 | $1,853,263 | $472,423 | 25.49% |
| 90% | $2,550,306 | $2,101,909 | $448,397 | 21.33% |
| 91% | $2,820,172 | $2,361,512 | $458,660 | 19.42% |
| 92% | $3,088,600 | $2,607,702 | $480,898 | 18.44% |
| 93% | $3,448,610 | $2,946,063 | $502,547 | 17.06% |
| 94% | $4,089,546 | $3,380,026 | $709,520 | 20.99% |
| 95% | $4,907,372 | $4,136,062 | $771,310 | 18.65% |
| 96% | $5,981,288 | $5,142,369 | $838,919 | 16.31% |
| 97% | $7,422,720 | $6,731,091 | $691,629 | 10.28% |
| 98% | $10,034,008 | $9,263,067 | $770,941 | 8.32% |
| 99% | $16,463,320 | $14,955,719 | $1,507,601 | 10.08% |
To read the chart: a dollar amount is the "threshold" between net worth brackets. More (or equal) wealth would go into the bracket shown, less would slot into the percentile right below.
For a round number look at some of the upper brackets, see the millionaires in America post.
Methodology on 2026 United States household net worth brackets
Data comes from the Federal Reserve's 2025 SCF, released in October 2026. You can find the Federal Reserve's summary report here, and you can find the data descriptions here.
The public data set (the one used by DQYDJ) contains 4,360 of the 4,367 observations in the full data set – 7 respondents had net worth high enough to make the Forbes list, so the Fed omits them from the public file. Our mean net worth ($1,231,997) matches the Fed's own public-file table ($1,232,000, rounded), versus $1,241,500 from its internal data – a difference of under 1% from those omitted households and smaller privacy edits. Medians are essentially identical.
Is this household net worth data?
Technically, this is not exactly household data but primary economic unit data. If you squint they are very close, but PEUs are:
"In brief, the PEU consists of an economically dominant single individual or couple (married or living as partners) in a household and all other individuals in the household who are financially interdependent with that individual or couple. For example, in the case of a household composed of a married couple who own their home, a minor child, a dependent adult child, and a financially independent parent of one of the members of the couple, the PEU would be the couple and the two children."
Federal Reserve SCF Data Codebook, 2025
In practice, that means a young adult who still lives with and depends on their parents is counted in their parents' unit. And the youngest "households" in the data are the ones who've struck out on their own.
How many samples are in the 2026 and 2023 data?
- 2023: 4,602 surveys with 7 redactions. Estimated PEUs of 131,306,390.
- 2026: 4,367 surveys with 7 redactions. Estimated PEUs of 134,963,691.
Does this data include capitalized cash flows, such as Social Security or defined benefit plans and pensions?
Good question – no. It's relatively straightforward to convert net worth to cash flow, but it's extremely difficult to move in the other direction. In short: you can't really "sell" a pension on the open market.
That said, there is a lot of high-quality recent scholarship on this topic, including a number of papers since the last net worth release. If you feel really strongly on the topic, let me know your arguments – if I work it into the data, I'd probably add it via the net worth percentile calculator.
Check out these posts for a technical discussion on converting defined benefit plans (and Social Security) to capitalized dollar amounts:
- Bricker, Jesse, Sarena Goodman, Kevin B. Moore, and Alice Henriques Volz (2020). "Wealth and Income Concentration in the SCF: 1989–2019," FEDS Notes. Washington: Board of Governors of the Federal Reserve System, September 28, 2020, https://doi.org/10.17016/2380-7172.2795.
- (Section "Allocating DB wealth")
- Sabelhaus, John, and Alice Henriques Volz (2019). "Are Disappearing Employer Pensions Contributing to Rising Wealth Inequality?," FEDS Notes. Washington: Board of Governors of the Federal Reserve System, February 1, 2019, https://doi.org/10.17016/2380-7172.2308.
- (Section "Estimating DB Retirement Wealth for SCF Families")
- Congressional Budget Office (2024). "Trends in the Distribution of Family Wealth, 1989 to 2022." October 2024, https://www.cbo.gov/publication/60343.
- Catherine, Sylvain, Max Miller, and Natasha Sarin (2025). "Social Security and Trends in Wealth Inequality," Journal of Finance 80(3): 1497–1531, https://doi.org/10.1111/jofi.13440.
- Llanes, Elizabeth, Jeffrey Thompson, and Alice Henriques Volz (2025). "Do the Rich Really Save More? Answering an Old Question Using the SCF with Direct Measures of Lifetime Earnings and an Expanded Wealth Concept," Finance and Economics Discussion Series 2025-097. Washington: Board of Governors of the Federal Reserve System, https://doi.org/10.17016/FEDS.2025.097.
Of course, the single biggest variable in Social Security's future value isn't a discount rate – it's Congress. Future trust fund fixes or depletion, benefit cuts, means testing, formula tweaks: everything is possible, and nothing is set. Try as we might, DQYDJ can't model the whims of future Congresses.
Discussion on median minutiae (alt: why our medians differ from the Fed's)
The SCF fills in missing answers five times, a technique called multiple imputation. The public microdata release contains multiple 'copies' of every household (well, PEUs). These copies are identical except for filled-in answers.
When you work from the multiple imputations, there are multiple (ahem) ways to compute the stats:
| Method | Median | Top 10% | Top 1% | Mean |
| Pool the five copies (weights /5) | $216,100 | $2,538,520 | $16,269,700 | $1,231,997 |
| Average the five results | $215,916 | $2,550,306 | $16,463,320 | $1,231,997 |
| Median of the five copies | $216,530 | $2,530,850 | $16,642,400 | – |
| Take the first copy | $210,900 | $2,449,580 | $15,856,000 | $1,196,123 |
| Range across the five copies | $210,900–$220,200 | $2.45M–$2.70M | $15.86M–$16.86M | $1.196M–$1.259M |
| Fed internal data | $215,900 | – | – | $1,241,500 |
| Method | Who uses it |
| Pool the five copies (weights /5) | The Fed's published tables (public data, Table 4) and the codebook's shortcut |
| Average the five results | Donald B. Rubin's rules (the textbook approach); Anthony Damico at asdfree's approach; Poverty and Inequality with Complex Survey Data (Guilherme Jacob, Anthony Damico, and Djalma Pessoa), which the Fed links; DQYDJ (PK - that's me!) |
| Median of the five copies | A robust variant, rarely used |
| Take the first copy | A common shortcut |
| Range across the five copies | The table above, for one |
| Fed internal data | The Fed bulletin's headline numbers and the Fed's internal-data tables |
As you can see, averages aren't sensitive to how you pool, but percentiles do move – so I figured I should make a callout section in case you're wondering why there are slight differences between my results and others!
But, the takeaway here is most methods are roughly comparable. The robust methods land within ~1% of each other. For example, our median is $215,916 to the Fed table's $216,100. Even in smaller groups, like our age brackets, medians typically differ by ~1-1.5%.
Is household net worth gross or net?
It is best to assume this is gross net worth – it is near impossible to guess at after-tax net worth. See the closer of the Social Security FAQ above for more.
Consider this what a household (or PEU) controls today, but not necessarily what they'd be left with after taxes if they liquidated.
Past data:
