
On this page is a household net worth percentile calculator for the United States. Enter a total net worth to compare it to the net worth distribution in the United States.
Afterwards, don't miss the net worth by age calculator.
Survey results collected from spring 2025 through May 2026 by the Federal Reserve SCF. (Newest data until ~late 2029.)
Household net worth percentile statistics in 2026
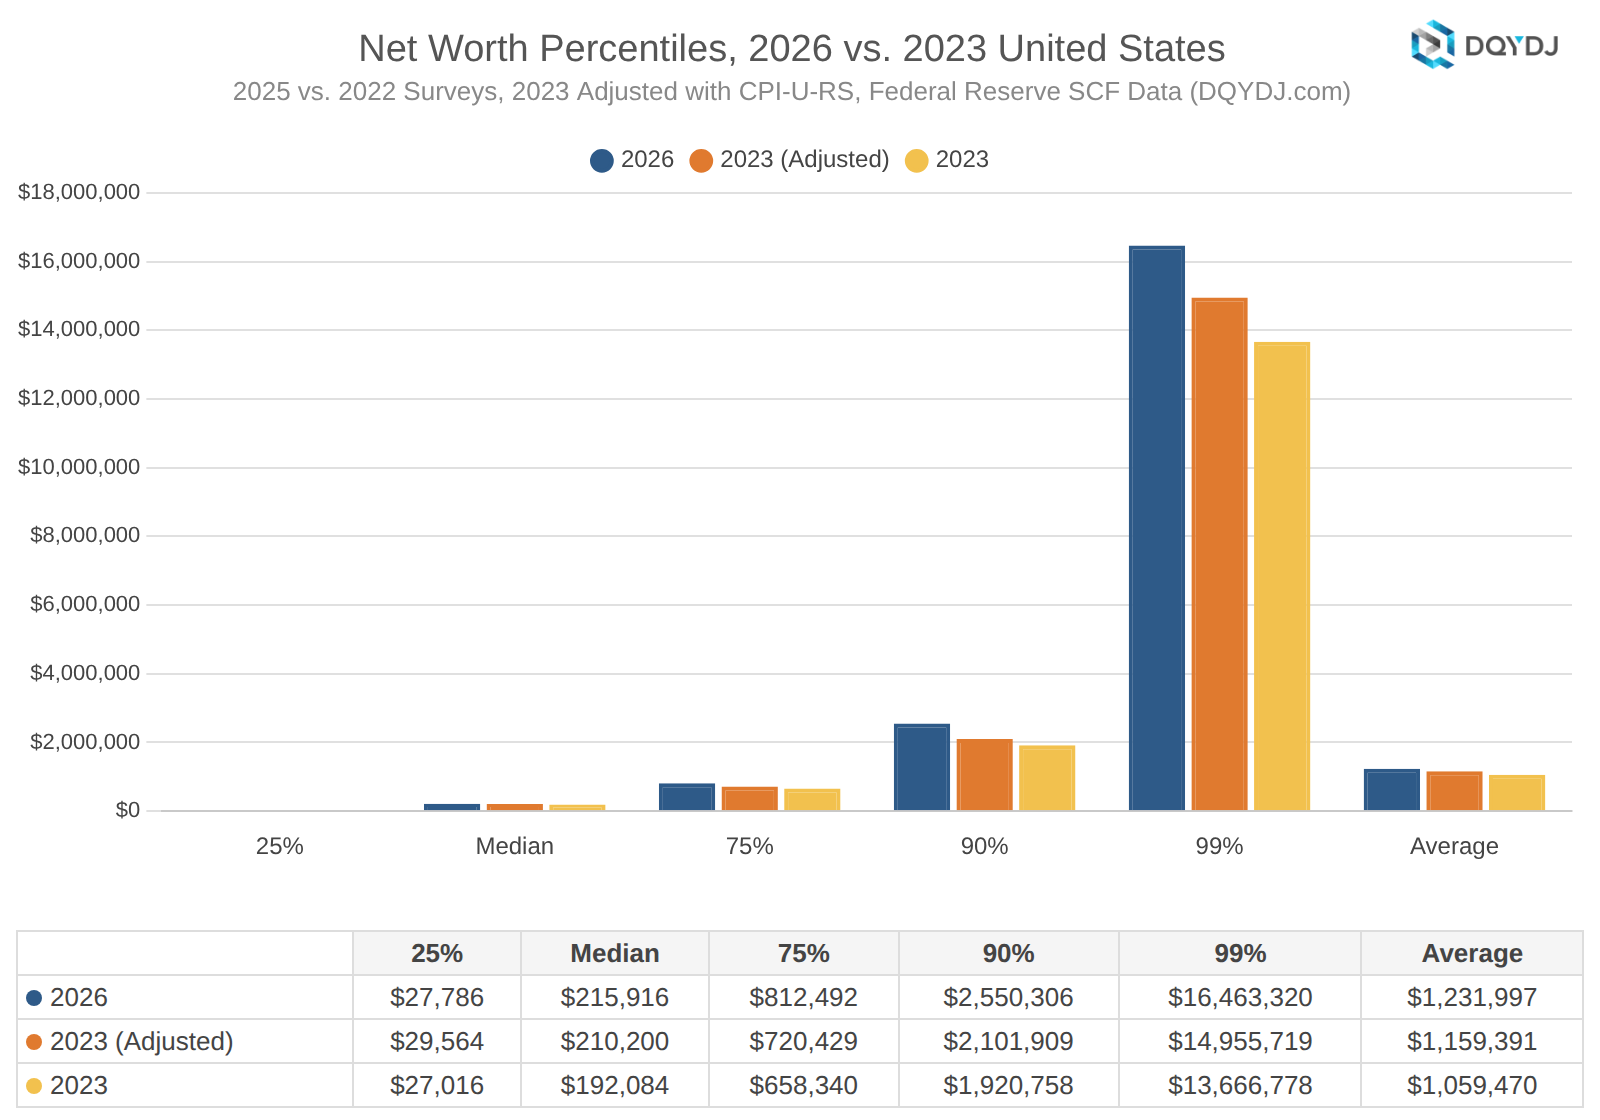
Below are some of the summary statistics on net worth this year.
What was the United States average household wealth?
In 2026, average household net worth in the United States was $1,231,997.
What was the United States median household net worth?
In 2026, median household net worth in the United States was $215,916.
How many US households had $1,000,000 or more in 2026?
In 2026, roughly 29,064,321 households – about 21.5% of American households – were millionaire households. This number includes (where possible to derive!) the value of a primary home.
Where did the top 10% household wealth bracket percentile start in 2026?
The threshold to be in the top 10% of household wealth in 2026 started at $2,550,306.
Where did the top 5% household wealth bracket percentile start in 2026?
The threshold to be in the top 5% of household wealth in 2026 started at $4,907,372.
What is the top one percent household net worth in the US in 2026?
To be in the top 1% of household wealth in the US in 2026 you needed $16,463,320.
(See our one percent in America article if you'd prefer seeing all the ways you can break down the top 1%.)
Source and methodology on the 2026 household net worth percentile calculator
Our longer writeup is in the net worth average, median, and percentile post. My data comes from the Federal Reserve's 2025 SCF, released in October 2026. Surveys started in spring of 2025, and about 1/7 of the surveys for this edition were conducted in 2026.
The public data – to be abundantly clear, the data I used here on DQYDJ – contains 4,360 of the 4,367 observations in the full data set included in the Fed's reports. Because of that, our numbers will not perfectly match all of the Fed's reports. For example, our mean net worth ($1,231,997) matches the Fed's rounded public-file estimate, but with the full data (including the 7 additional surveys) they computed a mean net worth of $1,241,500. And, yes, the median was essentially equivalent. Percentiles can also differ slightly from the Fed's tables because of how the survey's five copies of each household (technically PEU, or Primary Economic Unit) are combined – see the full methodology discussion.
Want to see how net worth brackets have evolved over time? Compare every survey since 1989 with our net worth by year tool, or try one of the past calculators:
