
On this page are estimated United States net worth brackets for 2023. (It's the newest data we'll have until 2026.)
Here you'll see average net worth, median net worth, top 1% net worth, and a comparison with the previous net worth data.
Net Worth Benchmarks in 2023
Just as with household income, the most important net worth statistics are:
- Median net worth
- Average net worth
- Top 1% net worth
Of these, median net worth is the most important statistic.
Although average net worth is higher than median (at $1,059,470 vs. $192,084, respectively), median is the 'middle point' of wealth. That is, half of households in the United States have more net worth, and half less – average is biased by high net worth households dragging the average upwards.
The numbers in these sections are nominal – they are not adjusted for inflation (later sections are, however).
Note: This data comes from the Federal Reserve SCF, released October, 2023. It comes from interviews mainly conducted in 2022. 25% of interviews were conducted in 2023.
What was the median net worth?
In 2023, $192,084 was the median household net worth in the United States. This is up from $121,411 in 2020.
What was the average net worth?
The average household net worth in 2023 was $1,059,470. It was $746,821 in 2020. See the inflation adjustment, below.
What is the top 1% household net worth?
To be top 1% in 2023, a household needed a net worth of $13,666,778. $11,099,166 was the 1% threshold in 2020.
What is the top .5% net worth? What is the top .1% household net worth?
To be top .5% in 2023, a household needed a net worth of $20,149,352. The top .1% bracket started around $61,827,166.
Note: up here, net worth estimates have a much larger error. Think on the order of +/- two million dollars for the .1% bracket. There is less survey data to inform the stats (although it's not bad – the survey does oversample likely high wealth households).
Selected United States Household Net Worth Percentiles for 2023 and 2020
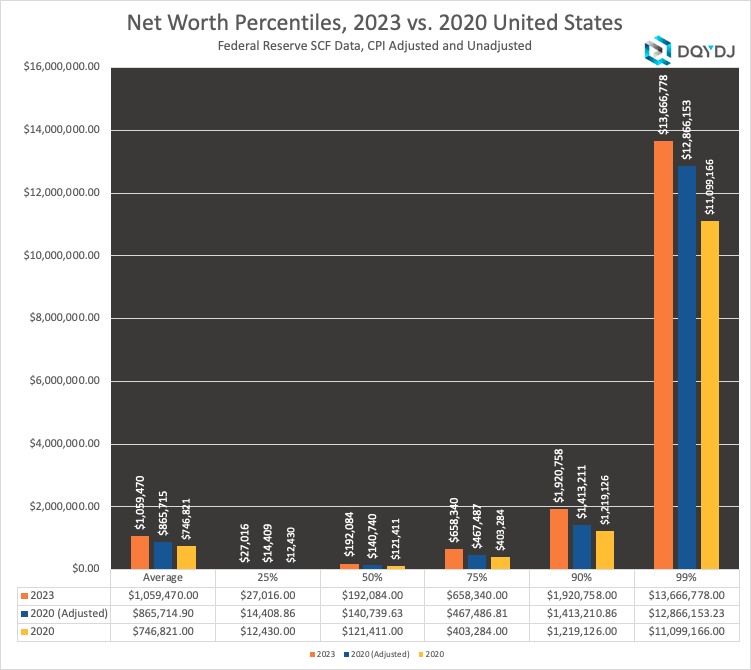
The most recent data is adjusted for CPI-U-RS [PDF] as detailed by the Fed. To do the inflation math versus the previous data, multiply 2020 dollar amounts by 1.1592.
Household Net Worth Percentiles for the United States in 2023
Below is every household net worth percentile in 2023, compared to inflation-adjusted 2020.
| Percentile | 2023 | 2020 | Difference | Change |
|---|---|---|---|---|
| 1% | -$76,472.00 | -$109,563.55 | $33,092 | |
| 2% | -$45,428.00 | -$63,602.13 | $18,174 | |
| 3% | -$26,450.00 | -$41,423.80 | $14,974 | |
| 4% | -$14,983.00 | -$30,065.29 | $15,082 | |
| 5% | -$9,878.00 | -$21,313.72 | $11,436 | |
| 6% | -$4,381.00 | -$13,824.69 | $9,444 | |
| 7% | -$831.80 | -$8,658.63 | $7,827 | |
| 8% | $1.00 | -$4,446.27 | $4,447 | |
| 9% | $182.20 | -$2,124.09 | $2,306 | |
| 10% | $440.20 | -$540.86 | $981 | |
| 11% | $990.20 | $3.98 | $986 | 24804.08% |
| 12% | $2,552.00 | $206.57 | $2,345 | 1135.42% |
| 13% | $4,056.00 | $582.43 | $3,474 | 596.39% |
| 14% | $5,208.00 | $997.98 | $4,210 | 421.85% |
| 15% | $6,532.20 | $1,828.28 | $4,704 | 257.29% |
| 16% | $7,726.00 | $3,005.57 | $4,720 | 157.06% |
| 17% | $9,256.00 | $4,001.60 | $5,254 | 131.31% |
| 18% | $10,370.40 | $5,193.71 | $5,177 | 99.67% |
| 19% | $11,810.00 | $6,234.61 | $5,575 | 89.43% |
| 20% | $13,528.00 | $7,382.19 | $6,146 | 83.25% |
| 21% | $15,600.20 | $8,535.73 | $7,064 | 82.76% |
| 22% | $18,022.20 | $9,866.87 | $8,155 | 82.65% |
| 23% | $20,716.00 | $11,231.67 | $9,484 | 84.44% |
| 24% | $23,310.00 | $12,493.09 | $10,817 | 86.58% |
| 25% | $27,016.00 | $14,408.98 | $12,607 | 87.49% |
| 26% | $30,316.20 | $16,458.08 | $13,858 | 84.20% |
| 27% | $34,242.00 | $18,617.90 | $15,624 | 83.92% |
| 28% | $39,436.00 | $20,989.19 | $18,447 | 87.89% |
| 29% | $44,734.00 | $23,579.15 | $21,155 | 89.72% |
| 30% | $51,366.00 | $27,467.96 | $23,898 | 87.00% |
| 31% | $57,040.00 | $31,588.28 | $25,452 | 80.57% |
| 32% | $62,600.20 | $35,928.65 | $26,672 | 74.23% |
| 33% | $67,500.00 | $42,175.13 | $25,325 | 60.05% |
| 34% | $73,120.20 | $47,082.79 | $26,037 | 55.30% |
| 35% | $79,054.00 | $52,258.85 | $26,795 | 51.27% |
| 36% | $84,256.00 | $58,434.33 | $25,822 | 44.19% |
| 37% | $89,534.00 | $64,229.63 | $25,304 | 39.40% |
| 38% | $96,524.00 | $69,023.35 | $27,501 | 39.84% |
| 39% | $101,964.00 | $73,150.04 | $28,814 | 39.39% |
| 40% | $110,314.00 | $78,210.15 | $32,104 | 41.05% |
| 41% | $117,810.00 | $83,233.43 | $34,577 | 41.54% |
| 42% | $125,686.00 | $87,868.97 | $37,817 | 43.04% |
| 43% | $132,632.00 | $93,207.42 | $39,425 | 42.30% |
| 44% | $141,164.00 | $97,845.99 | $43,318 | 44.27% |
| 45% | $147,316.00 | $103,804.45 | $43,512 | 41.92% |
| 46% | $155,908.00 | $110,104.53 | $45,803 | 41.60% |
| 47% | $164,132.00 | $116,603.53 | $47,528 | 40.76% |
| 48% | $172,168.00 | $123,264.12 | $48,904 | 39.67% |
| 49% | $181,562.00 | $132,374.65 | $49,187 | 37.16% |
| 50% | $192,084.00 | $140,740.06 | $51,344 | 36.48% |
| 51% | $202,106.20 | $147,735.90 | $54,370 | 36.80% |
| 52% | $212,562.00 | $155,573.60 | $56,988 | 36.63% |
| 53% | $223,554.00 | $164,167.82 | $59,386 | 36.17% |
| 54% | $238,034.00 | $173,913.48 | $64,121 | 36.87% |
| 55% | $250,380.00 | $183,652.59 | $66,727 | 36.33% |
| 56% | $261,644.00 | $194,130.85 | $67,513 | 34.78% |
| 57% | $274,944.00 | $202,794.81 | $72,149 | 35.58% |
| 58% | $288,614.00 | $211,090.39 | $77,524 | 36.73% |
| 59% | $298,884.00 | $222,484.91 | $76,399 | 34.34% |
| 60% | $312,622.00 | $233,360.13 | $79,262 | 33.97% |
| 61% | $327,622.00 | $244,703.29 | $82,919 | 33.89% |
| 62% | $347,520.00 | $254,335.13 | $93,185 | 36.64% |
| 63% | 366,448.00 | 264,950.46 | $101,498 | 38.31% |
| 64% | 384,910.00 | 276,252.96 | $108,657 | 39.33% |
| 65% | 402,800.00 | 288,800.11 | $114,000 | 39.47% |
| 66% | 415,460.00 | 301,562.41 | $113,898 | 37.77% |
| 67% | 429,190.00 | 315,157.59 | $114,032 | 36.18% |
| 68% | 447,958.00 | 334,427.04 | $113,531 | 33.95% |
| 69% | 468,284.20 | 350,078.23 | $118,206 | 33.77% |
| 70% | 493,068.00 | 365,055.97 | $128,012 | 35.07% |
| 71% | 521,000.20 | 380,933.26 | $140,067 | 36.77% |
| 72% | 551,988.00 | 404,981.00 | $147,007 | 36.30% |
| 73% | 587,968.00 | 424,173.51 | $163,794 | 38.61% |
| 74% | 622,546.00 | 443,871.17 | $178,675 | 40.25% |
| 75% | 658,340.00 | 467,486.30 | $190,854 | 40.83% |
| 76% | 697,576.00 | 496,859.82 | $200,716 | 40.40% |
| 77% | 743,564.00 | 528,143.96 | $215,420 | 40.79% |
| 78% | 785,484.00 | 562,417.04 | $223,067 | 39.66% |
| 79% | 836,944.00 | 607,334.44 | $229,610 | 37.81% |
| 80% | 891,750.00 | 647,053.48 | $244,697 | 37.82% |
| 81% | 947,453.00 | 685,494.02 | $261,959 | 38.21% |
| 82% | 1,009,860.00 | 738,468.50 | $271,392 | 36.75% |
| 83% | 1,078,294.00 | 790,322.17 | $287,972 | 36.44% |
| 84% | 1,154,634.00 | 854,472.96 | $300,161 | 35.13% |
| 85% | 1,234,848.00 | 921,817.69 | $313,030 | 33.96% |
| 86% | 1,308,426.00 | 991,010.22 | $317,416 | 32.03% |
| 87% | 1,399,334.00 | 1,076,509.41 | $322,825 | 29.99% |
| 88% | 1,510,942.00 | 1,148,986.00 | $361,956 | 31.50% |
| 89% | 1,693,542.00 | 1,258,856.33 | $434,686 | 34.53% |
| 90% | 1,920,758.00 | 1,413,211.39 | $507,547 | 35.91% |
| 91% | 2,157,988.00 | 1,571,026.97 | $586,961 | 37.36% |
| 92% | 2,382,960.00 | 1,787,377.41 | $595,583 | 33.32% |
| 93% | 2,692,160.00 | 2,048,897.78 | $643,262 | 31.40% |
| 94% | 3,088,722.00 | 2,411,796.58 | $676,925 | 28.07% |
| 95% | 3,779,600.00 | 2,995,523.80 | $784,076 | 26.17% |
| 96% | 4,699,180.20 | 3,818,855.14 | $880,325 | 23.05% |
| 97% | 6,150,980.00 | 5,379,387.17 | $771,593 | 14.34% |
| 98% | 8,464,740.20 | 7,600,900.82 | $863,839 | 11.36% |
| 99% | 13,666,778.00 | 12,866,153.31 | $800,625 | 6.22% |
To read the chart: a dollar amount is the "threshold" between net worth brackets. More (or equal) wealth would go into the bracket shown, less would slot into the percentile right below.
For a round number look at some of the upper brackets, see the millionaires in America post.
Methodology on 2023 United States Household Net Worth Brackets
Data comes from the Federal Reserve's 2022 SCF, released in October, 2023. You can find the Federal Reserve's summary reports here, and you can find the data descriptions here.
Is this household net worth data?
Technically, this is not exactly household data but primary economic unit data. If you squint they are very close, but PEUs are:
"In brief, the PEU consists of an economically dominant single individual or couple (married or living as partners) in a household and all other individuals in the household who are financially interdependent with that individual or couple. For example, in the case of a household composed of a married couple who own their home, a minor child, a dependent adult child, and a financially independent parent of one of the members of the couple, the PEU would be the couple and the two children."
Federal Reserve SCF Data Codebook, 2022
How many samples are in the 2023 and 2020 data?
- 2020: 5,783 surveys with 6 redactions. Estimated PEUs of 128,642,430.
- 2023: 4,602 surveys with 7 redactions. Estimated PEUs of 131,306,390
Does this data include capitalized cash flows, such as Social Security or defined benefit plans and pensions?
Good question – no. It's relatively straightforward to convert net worth to cash flow, but it's extremely difficult to move in the other direction.
In short: you can't really "sell" a pension on the open market.
That said, there is some high-quality recent scholarship on this topic. If you feel really strongly on the topic, let me know your arguments – if I work it into the data, I'd probably add it via the net worth percentile calculator.
Check out these posts for a technical discussion on converting defined benefit plans to capitalized dollar amounts:
- Bricker, Jesse, Sarena Goodman, Kevin B. Moore, and Alice Henriques Volz (2020). "Wealth and Income Concentration in the SCF: 1989–2019," FEDS Notes. Washington: Board of Governors of the Federal Reserve System, September 28, 2020, https://doi.org/10.17016/2380-7172.2795.
- (Section "Allocating DB wealth")
- Sabelhaus, John, and Alice Henriques Volz (2019). "Are Disappearing Employer Pensions Contributing to Rising Wealth Inequality?," FEDS Notes. Washington: Board of Governors of the Federal Reserve System, February 1, 2019, https://doi.org/10.17016/2380-7172.2308.
- (Section "Estimating DB Retirement Wealth for SCF Families")
Is household net worth gross or net?
It is best to assume this is gross net worth – it is near impossible to guess at after-tax net worth.
Consider this what a household (or PEU) controls today, but not necessarily what they'd be left with after taxes if they liquidated.
Past data:
