
On this page is an individual income percentile by age calculator for the United States for 2025.
Enter age and pre-tax (gross) income earned in full-year 2024 to compare to income distribution by age. Optionally, plot income distribution for other ages using the pull-down menu.
(Find the math and methodology in the median, top 1%, and average income by age research post.)
What else is there? See our individual income calculator and household income calculator.
What was the average and median income by age in 2025?
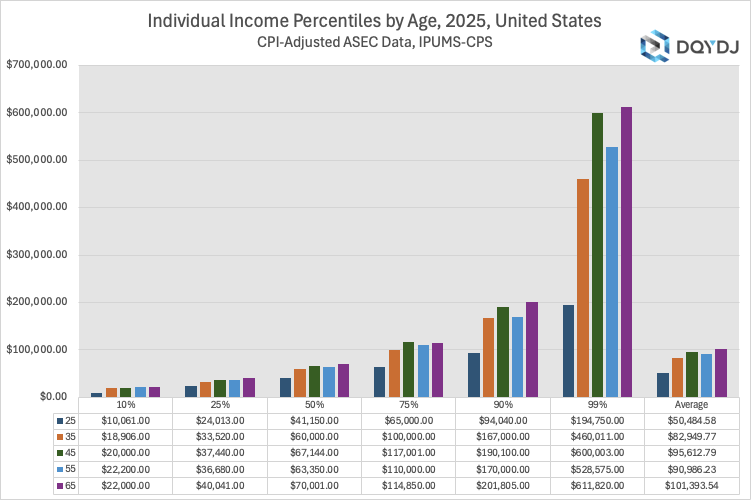
In this chart I've listed the median and average income by age, plus the top 1% by age. For completeness, it also includes the 25%, 75%, and 90% income by age breakpoints.
| Age | 10% | 25% | Median | 75% | 90% | Top 1% | Average |
| 16 | $0 | $50 | $2,500 | $7,500 | $21,601 | $71,528 | $7,980 |
| 17 | $0 | $500 | $4,000 | $10,000 | $16,001 | $79,000 | $10,993 |
| 18 | $0 | $1,922 | $7,000 | $16,500 | $32,002 | $82,000 | $13,277 |
| 19 | $225 | $5,824 | $15,000 | $27,000 | $40,050 | $85,000 | $18,736 |
| 20 | $1,000 | $7,000 | $19,000 | $31,201 | $47,000 | $91,200 | $22,772 |
| 21 | $2,730 | $10,003 | $23,000 | $35,390 | $55,104 | $106,000 | $26,883 |
| 22 | $3,000 | $12,186 | $26,750 | $40,000 | $60,000 | $130,300 | $30,495 |
| 23 | $4,000 | $17,000 | $32,000 | $50,000 | $73,000 | $172,610 | $39,387 |
| 24 | $8,000 | $20,399 | $35,160 | $53,000 | $76,300 | $175,002 | $41,042 |
| 25 | $10,061 | $24,013 | $41,150 | $65,000 | $94,040 | $194,750 | $50,485 |
| 26 | $12,000 | $24,500 | $45,000 | $66,100 | $100,000 | $205,120 | $53,046 |
| 27 | $13,200 | $29,110 | $48,000 | $75,011 | $118,135 | $231,828 | $59,195 |
| 28 | $14,500 | $30,000 | $50,000 | $75,651 | $120,005 | $300,000 | $63,383 |
| 29 | $16,392 | $34,150 | $55,000 | $85,400 | $137,020 | $396,501 | $73,903 |
| 30 | $15,950 | $32,500 | $52,002 | $84,017 | $130,030 | $324,648 | $68,741 |
| 31 | $15,200 | $34,000 | $57,001 | $86,100 | $140,404 | $279,550 | $72,764 |
| 32 | $17,005 | $33,000 | $56,085 | $85,500 | $135,000 | $338,401 | $71,526 |
| 33 | $16,000 | $35,000 | $58,000 | $95,000 | $151,815 | $329,700 | $76,642 |
| 34 | $17,001 | $35,000 | $58,000 | $92,100 | $146,001 | $354,035 | $75,869 |
| 35 | $18,906 | $33,520 | $60,000 | $100,000 | $167,000 | $460,011 | $82,950 |
| 36 | $20,655 | $38,000 | $62,150 | $104,050 | $161,353 | $542,180 | $87,603 |
| 37 | $15,541 | $35,000 | $60,002 | $102,802 | $162,010 | $532,003 | $86,864 |
| 38 | $16,971 | $36,102 | $64,136 | $106,203 | $167,762 | $470,510 | $86,043 |
| 39 | $20,299 | $37,000 | $63,400 | $104,010 | $167,551 | $503,450 | $88,055 |
| 40 | $19,201 | $39,000 | $61,970 | $106,020 | $178,001 | $483,400 | $90,657 |
| 41 | $19,476 | $35,000 | $63,520 | $108,120 | $172,000 | $581,000 | $91,350 |
| 42 | $18,000 | $35,000 | $62,050 | $105,105 | $171,001 | $450,007 | $87,118 |
| 43 | $20,000 | $39,100 | $64,111 | $101,000 | $176,710 | $600,100 | $91,843 |
| 44 | $20,000 | $36,000 | $61,308 | $103,125 | $164,162 | $508,127 | $86,691 |
| 45 | $20,000 | $37,440 | $67,144 | $117,001 | $190,100 | $600,003 | $95,613 |
| 46 | $18,000 | $37,800 | $65,000 | $111,075 | $169,000 | $488,060 | $90,412 |
| 47 | $20,000 | $38,000 | $65,000 | $113,899 | $181,013 | $532,881 | $94,495 |
| 48 | $24,956 | $40,000 | $66,500 | $111,326 | $185,400 | $643,300 | $94,234 |
| 49 | $20,000 | $40,000 | $65,023 | $111,200 | $173,501 | $623,865 | $93,511 |
| 50 | $18,000 | $36,931 | $65,000 | $113,501 | $190,900 | $554,105 | $93,486 |
| 51 | $17,940 | $38,221 | $65,001 | $115,220 | $179,502 | $467,000 | $91,749 |
| 52 | $22,000 | $40,001 | $70,001 | $115,045 | $192,001 | $606,100 | $98,664 |
| 53 | $20,145 | $40,001 | $70,000 | $117,195 | $195,250 | $727,500 | $99,539 |
| 54 | $21,000 | $37,264 | $65,002 | $113,200 | $180,000 | $651,450 | $96,259 |
| 55 | $22,200 | $36,680 | $63,350 | $110,000 | $170,000 | $528,575 | $90,986 |
| 56 | $20,000 | $36,165 | $62,690 | $109,286 | $190,344 | $500,002 | $93,387 |
| 57 | $19,000 | $38,100 | $64,025 | $107,201 | $185,693 | $843,000 | $97,050 |
| 58 | $20,000 | $35,085 | $62,020 | $107,910 | $198,202 | $765,899 | $96,625 |
| 59 | $22,147 | $39,703 | $64,501 | $112,010 | $188,865 | $1,099,999 | $103,337 |
| 60 | $19,900 | $36,000 | $62,001 | $101,700 | $170,060 | $585,000 | $90,224 |
| 61 | $20,000 | $38,000 | $61,200 | $103,160 | $180,000 | $527,250 | $92,650 |
| 62 | $21,000 | $37,872 | $66,020 | $108,200 | $189,002 | $622,027 | $94,554 |
| 63 | $21,000 | $35,256 | $65,000 | $112,011 | $196,301 | $600,040 | $96,759 |
| 64 | $18,908 | $35,000 | $60,000 | $106,045 | $180,551 | $504,105 | $88,657 |
| 65 | $22,000 | $40,041 | $70,001 | $114,850 | $201,805 | $611,820 | $101,394 |
| 66 | $19,815 | $35,001 | $57,601 | $99,147 | $167,741 | $356,370 | $81,625 |
| 67 | $22,960 | $37,944 | $63,602 | $114,252 | $175,512 | $643,439 | $93,166 |
| 68 | $22,000 | $37,082 | $63,172 | $110,002 | $196,300 | $371,220 | $93,842 |
| 69 | $24,779 | $42,027 | $67,580 | $114,200 | $191,200 | $584,838 | $95,589 |
| 70 | $21,358 | $38,000 | $63,455 | $122,400 | $203,005 | $385,000 | $93,423 |
| 71 | $26,137 | $38,232 | $60,883 | $109,750 | $239,200 | $436,145 | $98,747 |
| 72 | $26,410 | $48,039 | $72,346 | $120,000 | $200,976 | $533,023 | $108,814 |
| 73 | $26,220 | $37,901 | $64,006 | $103,676 | $176,554 | $453,540 | $86,333 |
| 74 | $25,000 | $39,012 | $60,500 | $98,601 | $176,602 | $1,134,092 | $100,531 |
| 75 | $19,000 | $36,240 | $61,440 | $107,002 | $204,355 | $379,904 | $89,913 |
As I say every year: the data is noisy. You can read the source post for some explanation, but know that we can't be perfect with these income breaks. You're getting a "feel" for the threshold, not the exact percentage – take a look at people a year older or younger as well.
Source and Methodology on the 2025 Individual Income Percentile by Age Calculator
Sarah Flood, Miriam King, Renae Rodgers, Steven Ruggles, J. Robert Warren, Daniel Backman, Etienne Breton, Grace Cooper, Julia A. Rivera Drew, Stephanie Richards, David Van Riper, and Kari C.W. Williams. IPUMS CPS: Version 13.0 [dataset]. Minneapolis, MN: IPUMS, 2025. https://doi.org/10.18128/D030.V13.0
To see our "worker" screen, read the individual income bracket post. Total income comes from many sources: here's a list.
To see the number of data points and estimated number of workers by age, see the income by age post. To narrow to just wage income, see the salary percentile by age calculator.
Individual Income Percentile by Age Calculators for Past Years
To see past editions of the income percentile by age calculator, here are the archives:
- 2024 US Individual Income by Age Calculator
- 2023 US Individual Income by Age Calculator
- 2022 US Individual Income by Age Calculator
- 2021 US Individual Income by Age Calculator
- 2020 US Individual Income by Age Calculator
- 2019 US Individual Income by Age Calculator
- 2018 US Individual Income by Age Calculator
- 2017 US Individual Income by Age Calculator
- 2016 US Individual Income by Age Calculator
- 2015 US Individual Income by Age Calculator
- 2014 US Individual Income by Age Calculator
- 2013 US Individual Income by Age Calculator
Want more? Also see our net worth calculator and net worth by age calculator.
