
On this page is an individual income percentile by age calculator in the United States for 2019. Enter an age and pre-tax income earned in full-year 2018 to compare to the income distribution by age. Also, you can plot income distribution for other ages using the pull-down menu.
Need a different tool? See our individual income calculator and household income calculator.
(Find the math and methodology in the median, top 1%, and average income by age research post.)
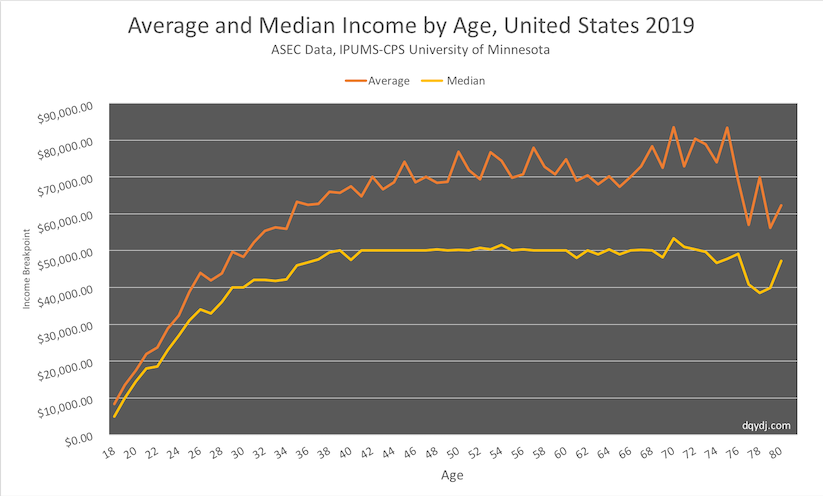
What was the average and median income by age in 2019?
In this chart I've listed the median and average income by age, plus the top 1% and the 25%, 75%, and 90% income by age breakpoints.
| Age | Average | 25% | Median | 75% | 90% | Top 1% (99%) |
| 18 | $8,419.92 | $1,600.00 | $5,000.00 | $10,500.00 | $20,501.00 | $53,006.00 |
| 19 | $13,484.63 | $3,013.00 | $10,000.00 | $18,584.00 | $29,000.00 | $68,000.00 |
| 20 | $17,456.99 | $6,005.00 | $14,438.00 | $24,005.00 | $35,000.00 | $75,001.00 |
| 21 | $21,927.80 | $9,000.00 | $18,000.00 | $29,000.00 | $40,505.00 | $100,000.00 |
| 22 | $23,680.10 | $8,200.00 | $18,501.00 | $30,000.00 | $45,005.00 | $110,000.00 |
| 23 | $28,823.74 | $12,000.00 | $23,000.00 | $35,001.00 | $51,010.00 | $112,512.00 |
| 24 | $32,411.95 | $15,205.00 | $27,000.00 | $40,170.00 | $60,000.00 | $133,081.00 |
| 25 | $38,777.43 | $19,500.00 | $31,026.00 | $50,000.00 | $70,110.00 | $151,101.00 |
| 26 | $43,940.47 | $20,100.00 | $34,000.00 | $53,000.00 | $76,801.00 | $210,005.00 |
| 27 | $41,844.25 | $21,000.00 | $33,003.00 | $52,000.00 | $74,800.00 | $172,000.00 |
| 28 | $43,839.07 | $22,001.00 | $36,000.00 | $56,345.00 | $80,190.00 | $175,007.00 |
| 29 | $49,648.75 | $25,000.00 | $40,000.00 | $61,000.00 | $93,367.00 | $200,000.00 |
| 30 | $48,241.83 | $24,000.00 | $40,000.00 | $60,101.00 | $90,030.00 | $210,005.00 |
| 31 | $52,198.99 | $25,000.00 | $42,000.00 | $65,125.00 | $98,150.00 | $210,241.00 |
| 32 | $55,369.57 | $25,331.00 | $42,000.00 | $67,502.00 | $106,750.00 | $256,200.00 |
| 33 | $56,303.55 | $25,000.00 | $41,800.00 | $68,000.00 | $105,000.00 | $278,604.00 |
| 34 | $55,846.51 | $25,000.00 | $42,202.00 | $69,000.00 | $102,523.00 | $250,125.00 |
| 35 | $63,208.57 | $27,002.00 | $46,000.00 | $79,000.00 | $120,000.00 | $314,140.00 |
| 36 | $62,349.18 | $26,010.00 | $46,805.00 | $77,001.00 | $120,040.00 | $328,985.00 |
| 37 | $62,651.61 | $28,000.00 | $47,581.00 | $76,001.00 | $112,115.00 | $330,451.00 |
| 38 | $65,927.26 | $28,000.00 | $49,502.00 | $80,055.00 | $127,565.00 | $344,055.00 |
| 39 | $65,655.99 | $27,005.00 | $50,000.00 | $78,111.00 | $122,773.00 | $300,401.00 |
| 40 | $67,409.78 | $27,509.00 | $47,529.00 | $80,400.00 | $126,384.00 | $409,164.00 |
| 41 | $64,725.98 | $27,002.00 | $50,000.00 | $78,101.00 | $126,635.00 | $330,132.00 |
| 42 | $69,979.17 | $28,000.00 | $50,000.00 | $81,015.00 | $140,000.00 | $409,164.00 |
| 43 | $66,558.13 | $29,255.00 | $50,000.00 | $83,025.00 | $130,000.00 | $345,081.00 |
| 44 | $68,586.57 | $28,000.00 | $50,012.00 | $82,000.00 | $132,002.00 | $320,002.00 |
| 45 | $74,123.42 | $30,000.00 | $50,100.00 | $88,450.00 | $140,722.00 | $463,560.00 |
| 46 | $68,458.79 | $28,809.00 | $50,001.00 | $81,026.00 | $132,999.00 | $340,127.00 |
| 47 | $69,976.13 | $30,000.00 | $50,000.00 | $80,302.00 | $138,456.00 | $360,305.00 |
| 48 | $68,355.00 | $30,000.00 | $50,262.00 | $81,101.00 | $130,001.00 | $343,299.00 |
| 49 | $68,722.18 | $29,200.00 | $50,031.00 | $80,334.00 | $130,006.00 | $384,700.00 |
| 50 | $76,824.21 | $30,000.00 | $50,210.00 | $88,000.00 | $142,500.00 | $650,001.00 |
| 51 | $71,747.16 | $28,000.00 | $50,005.00 | $85,308.00 | $141,755.00 | $361,850.00 |
| 52 | $69,358.36 | $27,220.00 | $50,780.00 | $84,000.00 | $132,922.00 | $386,969.00 |
| 53 | $76,667.95 | $29,922.00 | $50,300.00 | $86,550.00 | $150,200.00 | $490,330.00 |
| 54 | $74,347.09 | $30,000.00 | $51,571.00 | $85,000.00 | $140,700.00 | $473,100.00 |
| 55 | $69,780.96 | $29,003.00 | $50,000.00 | $82,004.00 | $145,050.00 | $353,004.00 |
| 56 | $70,762.18 | $30,000.00 | $50,325.00 | $84,001.00 | $135,200.00 | $425,171.00 |
| 57 | $77,965.45 | $28,800.00 | $50,050.00 | $85,002.00 | $150,090.00 | $571,010.00 |
| 58 | $72,677.86 | $28,001.00 | $50,010.00 | $83,803.00 | $136,750.00 | $374,619.00 |
| 59 | $70,758.67 | $30,000.00 | $50,001.00 | $86,207.00 | $147,001.00 | $335,226.00 |
| 60 | $74,781.76 | $30,000.00 | $50,000.00 | $83,000.00 | $140,000.00 | $480,600.00 |
| 61 | $68,990.69 | $29,000.00 | $48,025.00 | $81,200.00 | $137,225.00 | $316,852.00 |
| 62 | $70,455.68 | $27,001.00 | $50,000.00 | $86,000.00 | $140,003.00 | $405,137.00 |
| 63 | $67,963.07 | $28,000.00 | $49,002.00 | $80,951.00 | $142,229.00 | $340,411.00 |
| 64 | $70,202.60 | $28,004.00 | $50,282.00 | $85,767.00 | $139,400.00 | $353,485.00 |
| 65 | $67,327.07 | $28,684.00 | $49,009.00 | $80,019.00 | $126,898.00 | $391,000.00 |
| 66 | $70,053.91 | $28,287.00 | $50,000.00 | $89,092.00 | $143,475.00 | $339,280.00 |
| 67 | $72,848.08 | $30,000.00 | $50,201.00 | $89,502.00 | $147,019.00 | $377,281.00 |
| 68 | $78,342.62 | $31,000.00 | $50,000.00 | $86,480.00 | $150,652.00 | $717,400.00 |
| 69 | $72,454.02 | $29,396.00 | $48,100.00 | $82,196.00 | $154,881.00 | $371,250.00 |
| 70 | $83,501.94 | $30,149.00 | $53,260.00 | $89,104.00 | $167,570.00 | $729,000.00 |
| 71 | $72,900.43 | $27,976.00 | $50,962.00 | $83,890.00 | $156,608.00 | $413,489.00 |
| 72 | $80,289.49 | $29,440.00 | $50,312.00 | $91,940.00 | $182,182.00 | $595,091.00 |
| 73 | $78,893.76 | $30,171.00 | $49,711.00 | $92,111.00 | $171,895.00 | $423,119.00 |
| 74 | $73,914.76 | $30,690.00 | $46,709.00 | $79,231.00 | $135,060.00 | $450,435.00 |
| 75 | $83,296.55 | $28,527.00 | $47,726.00 | $101,337.00 | $170,469.00 | $535,083.00 |
| 76 | $68,950.29 | $25,352.00 | $49,147.00 | $81,300.00 | $157,300.00 | $394,147.00 |
| 77 | $57,016.60 | $23,478.00 | $40,800.00 | $66,371.00 | $115,359.00 | $320,000.00 |
| 78 | $69,880.52 | $22,724.00 | $38,460.00 | $74,491.00 | $139,608.00 | $411,400.00 |
| 79 | $56,169.67 | $24,880.00 | $39,914.00 | $74,320.00 | $122,800.00 | $221,335.00 |
| 80 | $62,235.20 | $27,002.00 | $47,170.00 | $79,041.00 | $129,139.00 | $242,390.00 |
Yes, the data is a bit noisy. There is some explanation in the average income by age research post, but in short when you divide by age you are reducing the number of samples.
In your head, don't take the age income breakpoints as the final answer but instead as a reasonable approximation. Here's how it looks visually, lumps and all:
How many workers make $100,000 by age? How many workers make $250,000?
Commonly, we use $100,000 and $250,000 as the cutoffs for "high" income. And yes, of course, this interacts with cost of living and household construction (see our household income research). It's still useful to look at how common it is for individuals to make these large incomes.
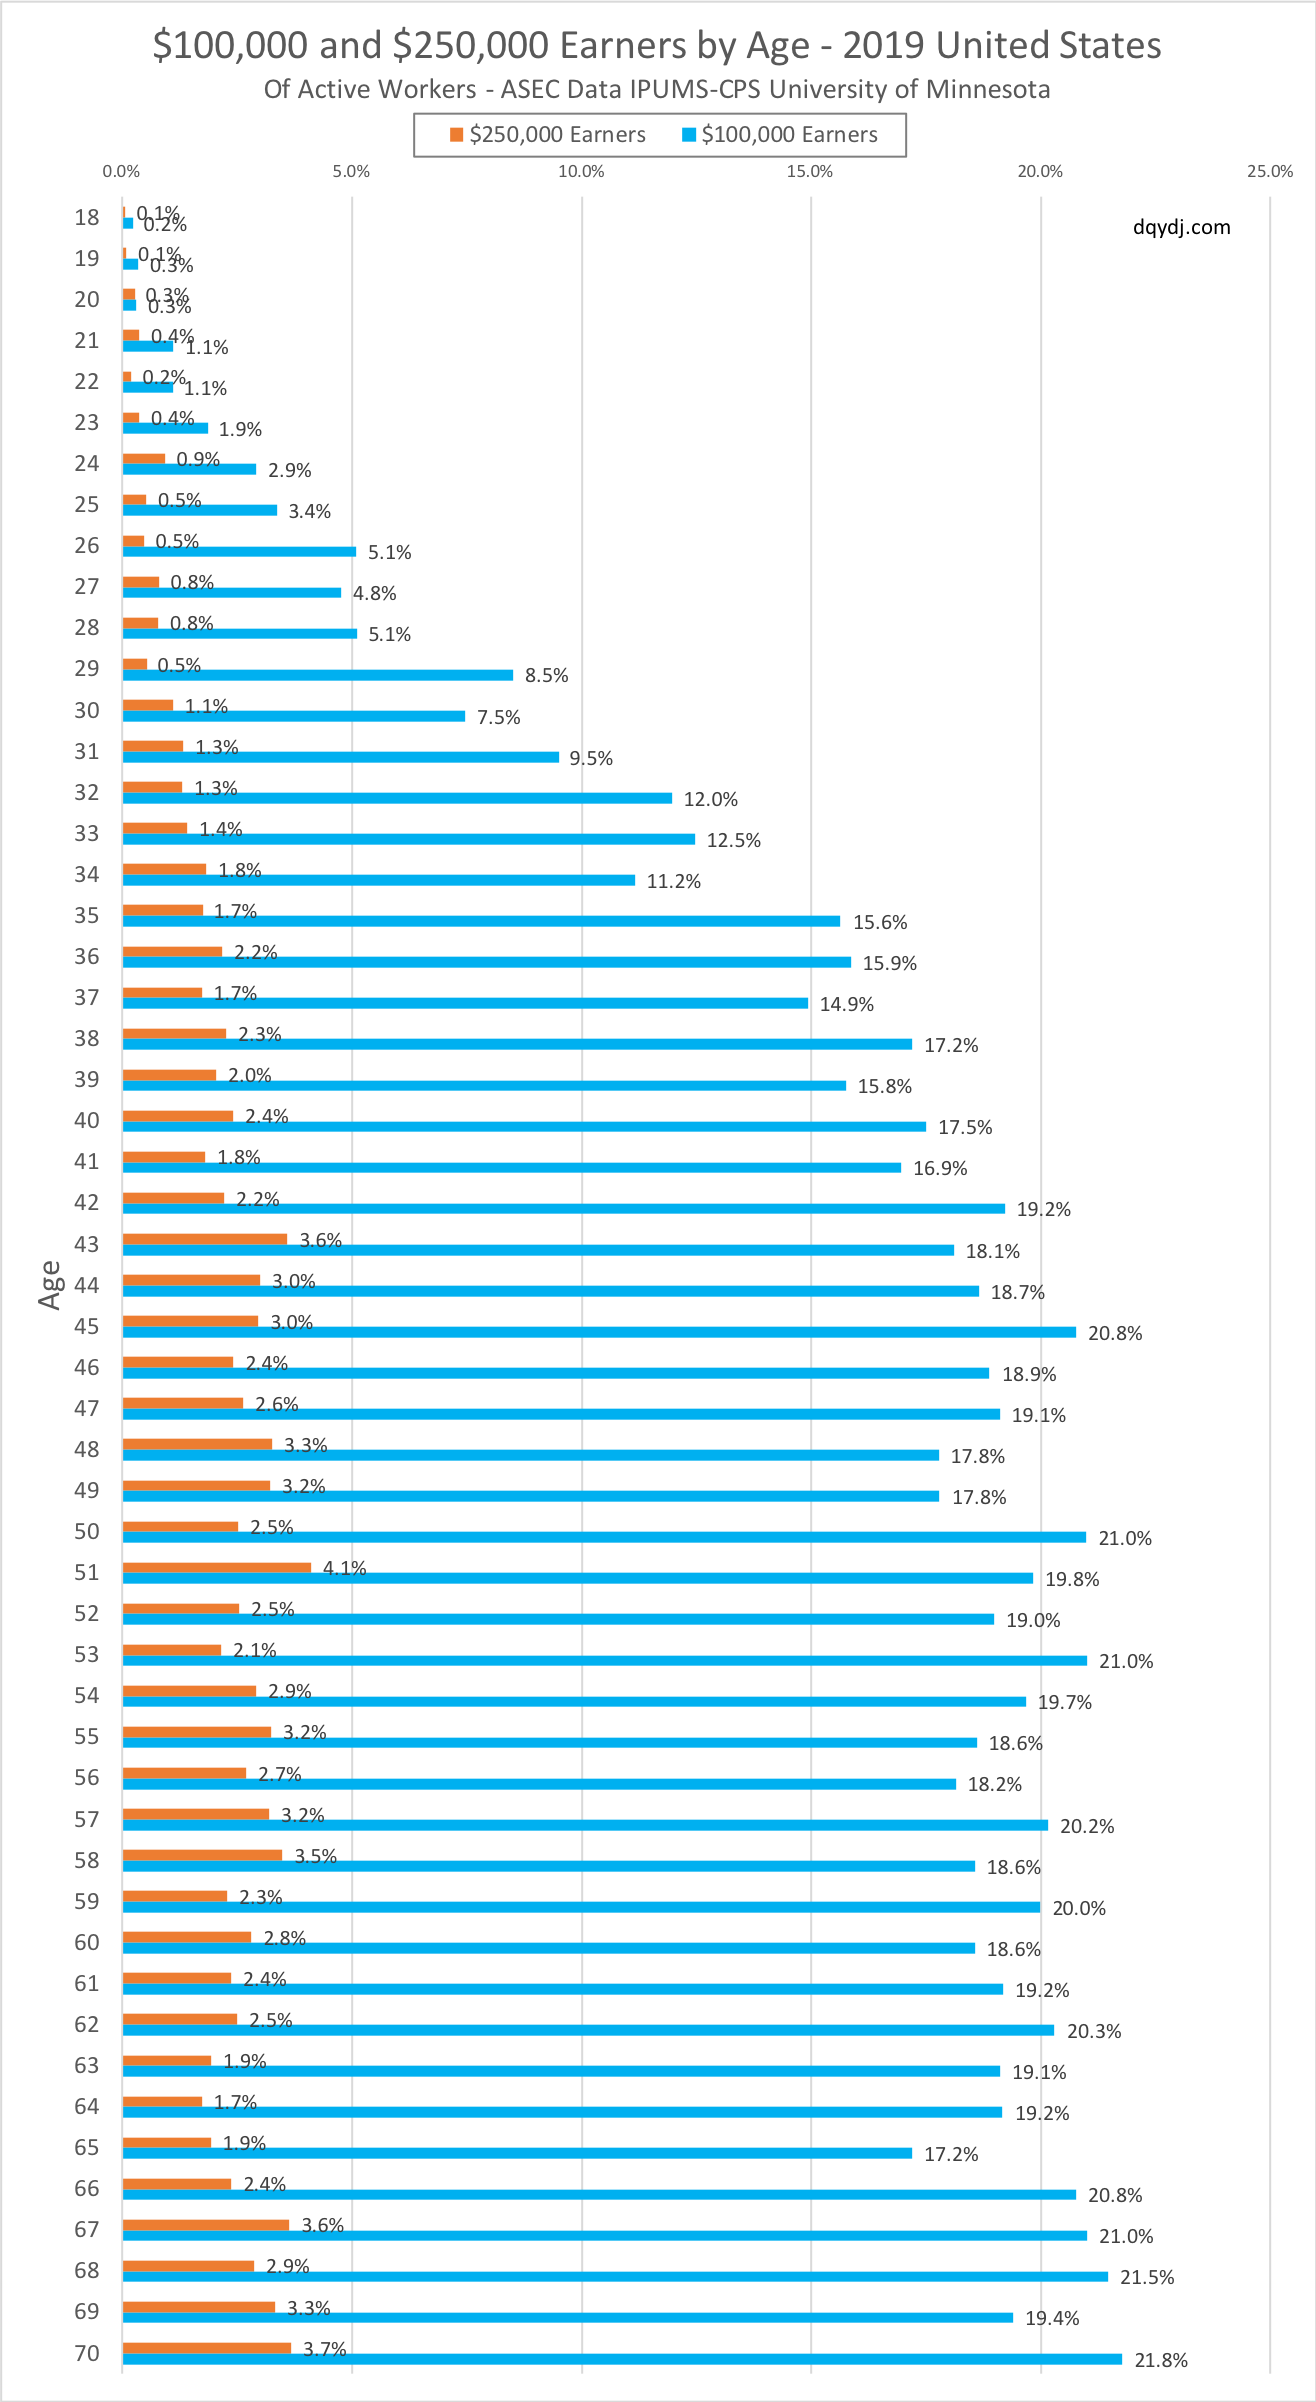
Please excuse that infographic-sized chart. I wanted to make sure you could see all ages from 18-70. Of note, this is "percentage of workers of a certain age", so especially beyond age 60 it interacts with retirement ages. You can cross this with our estimated worker count by age to get an estimated absolute number.
As before, mind the trend not the exact number. Like other research, this chart suggests default income growth – even for relatively high earners – until someone is in their low to mid-40s. More on that in the next few sections.
Average, Median and Selected Income Percentiles for Ages 25-65
Last year we dedicated a chart showing the 25th, 50th, and 75th percentile of earnings over a career.
My research shows that 66 is the median retirement age in the United States. That in mind, you can get a decent feel for the middle half of the income graph with this income visualization:
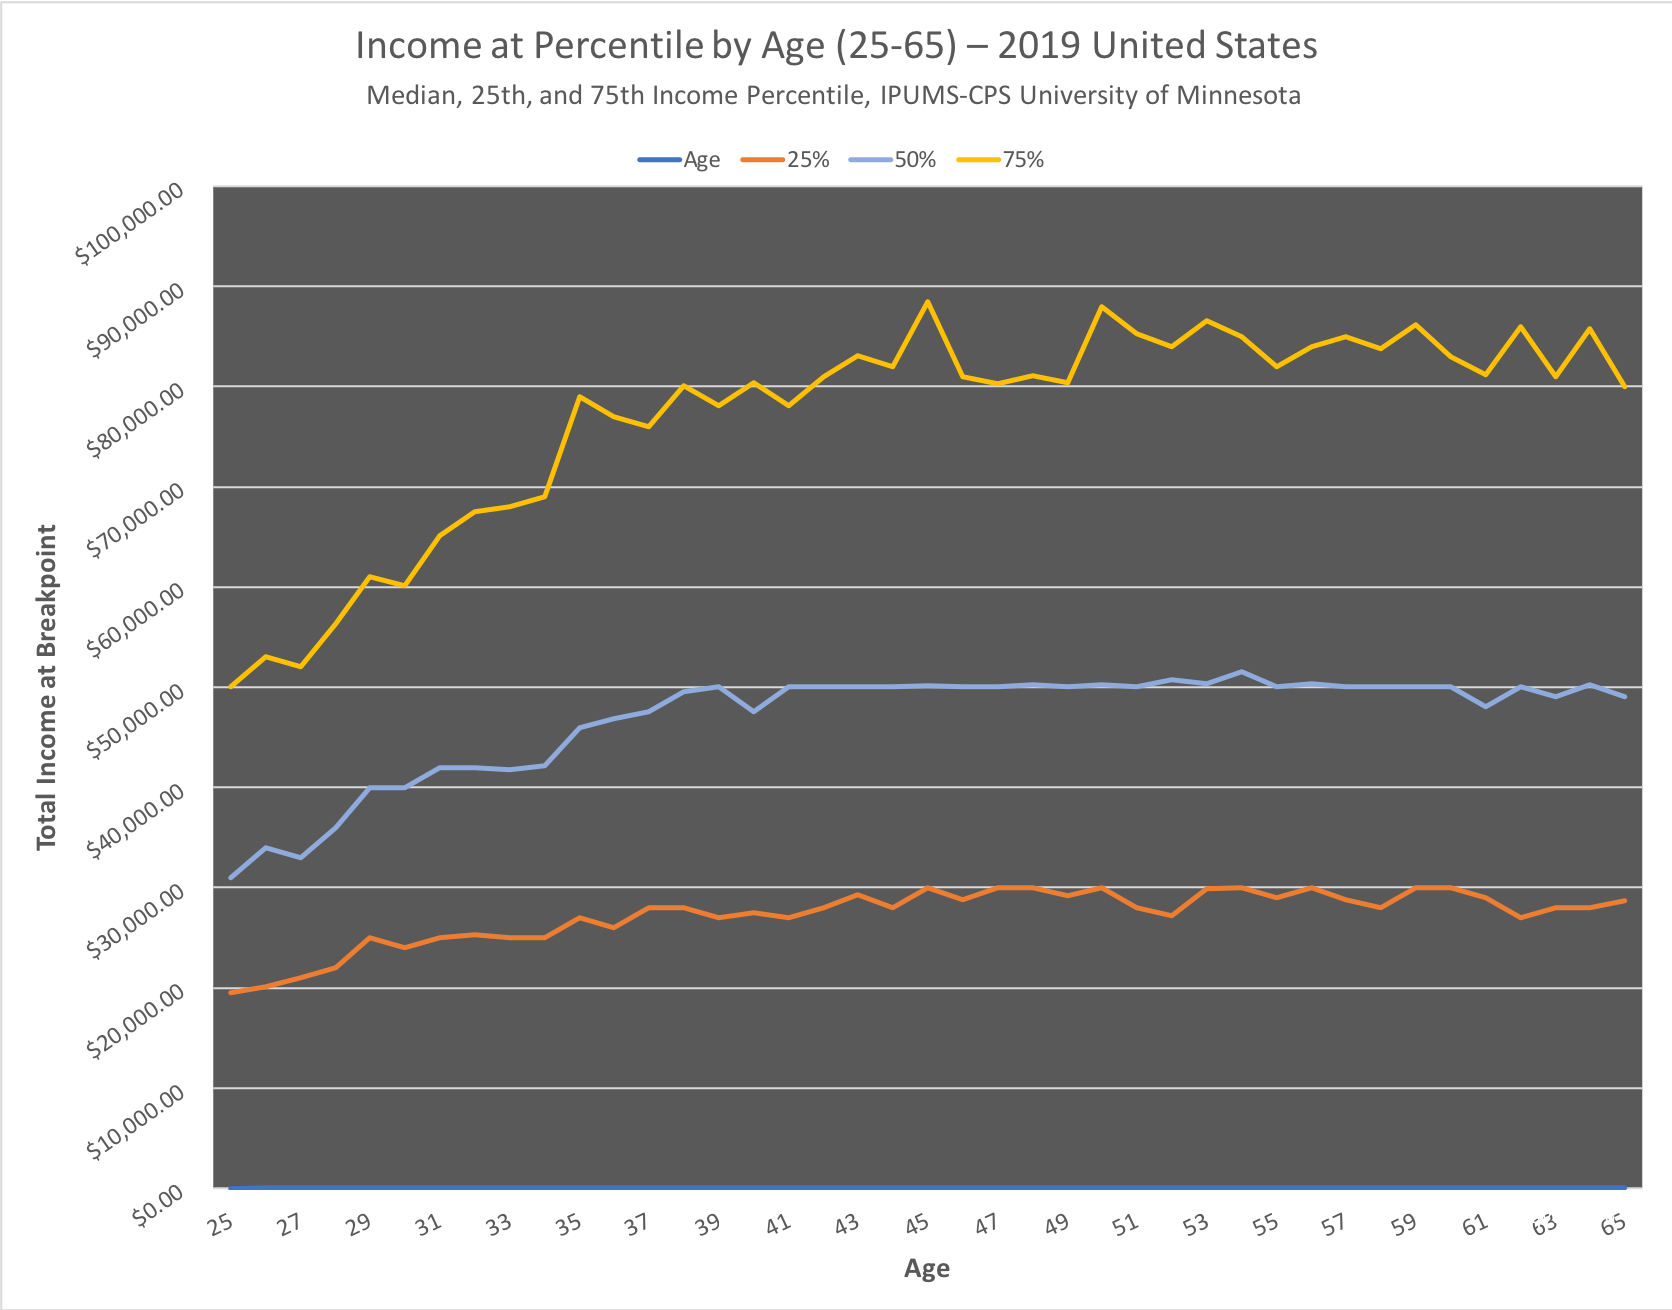
Once again, we see the common pattern - income at a percentile tends to rise from younger workers, and reaches a plateau around ages 38-42. That doesn't mean your income will top out at that age, it means that across ages 42-65 or so you can't count on the natural increase that comes with experience.
As I've been disclaiming on these posts: obviously this data isn't longitudinal.
This is a single, static snapshot of earners at one point in time and doesn't suggest anything about individual workers.
What does the income distribution graph show about income by age?
In a perfectly meritocratic country, ability to do the job, supply, demand, and experience would be the inputs to a fair salary model. I'm not implying the United States is perfect – but this is a reasonable model using the aggregate of workers across the country.
Age is a proxy for experience. Yes, people switch career and industries. Your humble host started as a Computer Engineer and I'm now in Marketing.
But – age is an excellent substitute for experience in this model. A 40 year old probably has 10-15 years of relevant experience doing their job. With this proxy in mind, income growth works like a rising tide for the first 17-20 years of a career. After that you have to become more effective relative to your peers to make a higher income.
Why might a maximum career earning years near 40-45 years old by wrong?
Hopefully these arguments (which I've now been making for 6 years) are convincing. Now let me argue the other side though.
In 0% of cases is a worker ever exactly tied to a single income percentile by age over a career. Event-based income from selling homes, accumulated stock, businesses, or other windfalls means people will move to the top 1% for a year, then drop out.
People’s relative income rank is changing constantly. And that movement – income mobility – is good.
You should want to control the lever and move up and down the income distribution. Again, the United States isn't a perfect meritocracy and I would never take that position.
But – squinting at this data does suggest the trajectory for the first half of a typical career.
Source and Methodology on the 2019 Individual Income Percentile by Age Calculator
Sarah Flood, Miriam King, Renae Rodgers, Steven Ruggles, and J. Robert Warren. Integrated Public Use Microdata Series, Current Population Survey: Version 6.0 [dataset]. Minneapolis, MN: IPUMS, 2019. https://doi.org/10.18128/D030.V6.0
Our "worker" methodology matches the 2019 individual income bracket post. Total income comes from a variety of sources: here's a list.
To see the number of data points and estimated number of workers by age, see the income by age post.
Individual Income Percentile by Age Calculators for Past Years
I've... been tracking this data for a while. To see past editions of the income percentile by age calculator, hit the archives:
- 2018 US Individual Income by Age Calculator
- 2017 US Individual Income by Age Calculator
- 2016 US Individual Income by Age Calculator
- 2015 US Individual Income by Age Calculator
- 2014 US Individual Income by Age Calculator
- 2013 US Individual Income by Age Calculator
Want more? Also see our net worth calculator and net worth by age calculator.
