
In this post are United States individual income brackets by age for 2026. You'll also find average income by age, median, and top 1% by age.
Individual incomes here are limited to Americans who worked (or wanted to work) in the calendar year. Incomes are gross (pre-tax) – and earned between January and December 2025.
If you missed them: we also have research on household incomes and individual incomes.
Individual income benchmarks by age in 2026
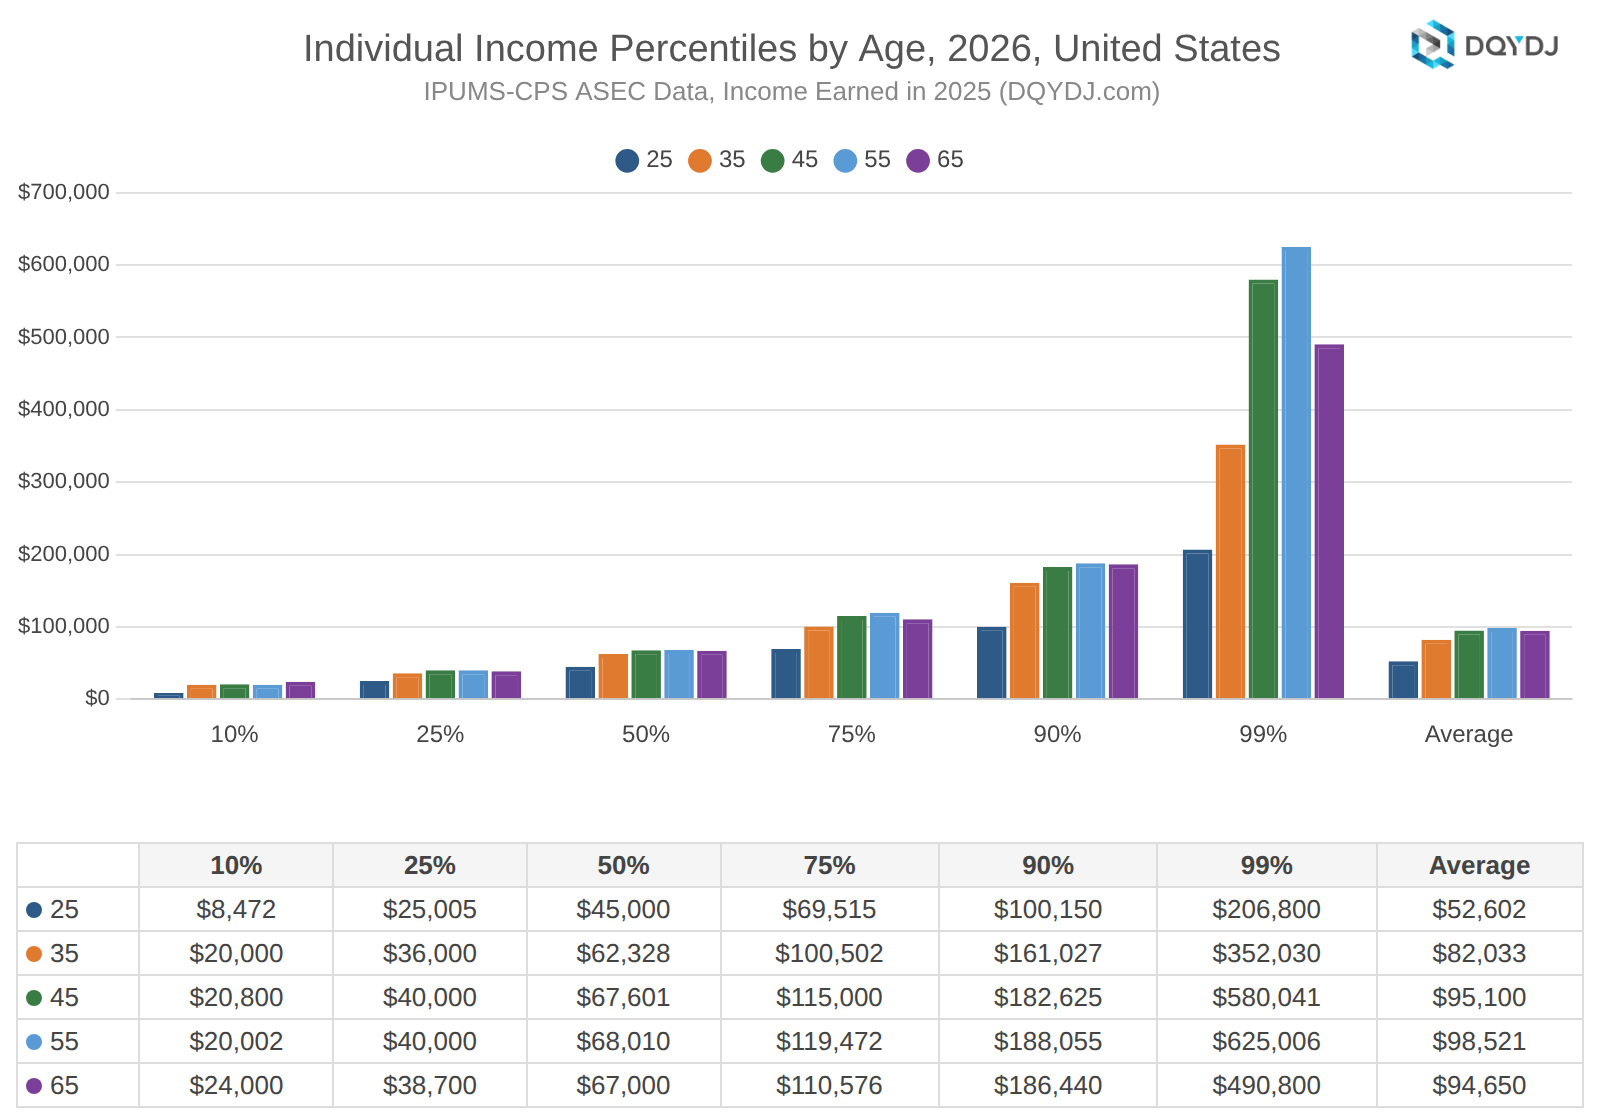
Age is an excellent way to break down income comparisons – it's a quick (but pretty good) proxy for experience. While it's not always true, generally, older folks will have more experience in a given field.
(Of course, you can think of the exceptions: career switching, job loss, and so on.)
And – like with other breakdowns of the population – the best summary statistics of income are:
- Median income
- Average income
- Top 1% income
What is the median individual income by age in the United States?
These are the median incomes by age for 2026 in the United States for some selected ages:
- Age 25: $45,000
- Age 35: $62,328
- Age 45: $67,601
- Age 55: $68,010
- Age 65: $67,000
Compare those to an overall median individual income of $55,584.
The following table has median income by age (16-75) in 2026 in the United States:
| Age | Median Income |
| 16 | $2,001 |
| 17 | $3,200 |
| 18 | $6,000 |
| 19 | $14,005 |
| 20 | $20,000 |
| 21 | $21,000 |
| 22 | $24,410 |
| 23 | $30,305 |
| 24 | $36,540 |
| 25 | $45,000 |
| 26 | $47,019 |
| 27 | $50,000 |
| 28 | $51,000 |
| 29 | $57,000 |
| 30 | $55,000 |
| 31 | $60,006 |
| 32 | $58,242 |
| 33 | $60,000 |
| 34 | $60,050 |
| 35 | $62,328 |
| 36 | $65,000 |
| 37 | $62,105 |
| 38 | $69,400 |
| 39 | $70,000 |
| 40 | $65,005 |
| 41 | $70,000 |
| 42 | $68,000 |
| 43 | $70,011 |
| 44 | $70,000 |
| 45 | $67,601 |
| 46 | $70,010 |
| 47 | $70,001 |
| 48 | $70,000 |
| 49 | $70,000 |
| 50 | $71,000 |
| 51 | $68,110 |
| 52 | $68,100 |
| 53 | $65,150 |
| 54 | $65,012 |
| 55 | $68,010 |
| 56 | $65,005 |
| 57 | $70,000 |
| 58 | $70,000 |
| 59 | $65,050 |
| 60 | $64,000 |
| 61 | $67,600 |
| 62 | $66,000 |
| 63 | $63,020 |
| 64 | $72,023 |
| 65 | $67,000 |
| 66 | $68,600 |
| 67 | $66,000 |
| 68 | $67,605 |
| 69 | $74,424 |
| 70 | $72,217 |
| 71 | $80,001 |
| 72 | $65,754 |
| 73 | $65,120 |
| 74 | $66,200 |
| 75 | $66,782 |
What is the average income by age in the United States?
Here are the 2026 average incomes by age for age 25 and ten-year intervals:
- Age 25: $52,601.61
- Age 35: $82,032.76
- Age 45: $95,099.85
- Age 55: $98,521.25
- Age 65: $94,650.26
The overall average individual income was $82,030.90 in 2026.
This table has the average income of workers at every age (16-75) in 2026:
| Age | Average Income |
| 16 | $7,218 |
| 17 | $7,319 |
| 18 | $13,044 |
| 19 | $20,708 |
| 20 | $24,169 |
| 21 | $27,248 |
| 22 | $31,513 |
| 23 | $37,720 |
| 24 | $42,744 |
| 25 | $52,602 |
| 26 | $53,367 |
| 27 | $59,988 |
| 28 | $63,061 |
| 29 | $66,698 |
| 30 | $71,189 |
| 31 | $79,507 |
| 32 | $80,611 |
| 33 | $74,288 |
| 34 | $81,933 |
| 35 | $82,033 |
| 36 | $86,251 |
| 37 | $87,085 |
| 38 | $95,047 |
| 39 | $100,470 |
| 40 | $96,535 |
| 41 | $100,430 |
| 42 | $95,384 |
| 43 | $100,727 |
| 44 | $102,311 |
| 45 | $95,100 |
| 46 | $102,656 |
| 47 | $100,752 |
| 48 | $104,804 |
| 49 | $102,118 |
| 50 | $105,560 |
| 51 | $100,317 |
| 52 | $103,946 |
| 53 | $94,764 |
| 54 | $103,740 |
| 55 | $98,521 |
| 56 | $95,524 |
| 57 | $97,811 |
| 58 | $109,991 |
| 59 | $100,709 |
| 60 | $95,866 |
| 61 | $99,467 |
| 62 | $96,969 |
| 63 | $88,691 |
| 64 | $100,651 |
| 65 | $94,650 |
| 66 | $97,320 |
| 67 | $102,720 |
| 68 | $94,247 |
| 69 | $111,265 |
| 70 | $112,994 |
| 71 | $105,471 |
| 72 | $94,682 |
| 73 | $100,514 |
| 74 | $100,716 |
| 75 | $102,096 |
What is the top 1% individual income by age in the United States?
Here are the summary top 1% income benchmarks starting at 25 years old and moving up a decade at a time:
- Age 25: $206,800
- Age 35: $352,030
- Age 45: $580,041
- Age 55: $625,006
- Age 65: $490,800
Among these five ages, last year age 65 led at both the median and the top 1%. This year, age 55 led – and the 65-year-old top 1% threshold fell from $611,820 to $490,800.
Treat this data with more skepticism than median or average. By definition, there are fewer top earners than those near the middle of the earning spectrum. Before you take a single age's measure as "truth", look at a couple adjacent ages for a good feel of what the "actual" 1% might be.
That in mind, here is the table for top 1% income by age in the United States in 2026:
| Age | Top 1% Income |
| 16 | $112,701 |
| 17 | $67,000 |
| 18 | $86,400 |
| 19 | $107,000 |
| 20 | $100,000 |
| 21 | $124,999 |
| 22 | $120,238 |
| 23 | $128,002 |
| 24 | $150,500 |
| 25 | $206,800 |
| 26 | $200,004 |
| 27 | $233,202 |
| 28 | $257,001 |
| 29 | $248,875 |
| 30 | $341,000 |
| 31 | $438,000 |
| 32 | $500,000 |
| 33 | $301,950 |
| 34 | $380,105 |
| 35 | $352,030 |
| 36 | $422,500 |
| 37 | $457,800 |
| 38 | $600,000 |
| 39 | $624,000 |
| 40 | $753,450 |
| 41 | $660,000 |
| 42 | $590,003 |
| 43 | $691,124 |
| 44 | $523,643 |
| 45 | $580,041 |
| 46 | $624,400 |
| 47 | $647,410 |
| 48 | $930,424 |
| 49 | $590,001 |
| 50 | $779,220 |
| 51 | $556,692 |
| 52 | $644,001 |
| 53 | $502,600 |
| 54 | $791,300 |
| 55 | $625,006 |
| 56 | $641,700 |
| 57 | $558,503 |
| 58 | $940,016 |
| 59 | $822,175 |
| 60 | $550,101 |
| 61 | $686,000 |
| 62 | $615,001 |
| 63 | $407,603 |
| 64 | $560,200 |
| 65 | $490,800 |
| 66 | $651,600 |
| 67 | $610,976 |
| 68 | $450,000 |
| 69 | $640,000 |
| 70 | $593,703 |
| 71 | $444,003 |
| 72 | $369,420 |
| 73 | $628,223 |
| 74 | $565,400 |
| 75 | $569,085 |
United States individual income percentiles by age
Income is all income earned by one individual. That includes:
- Wage income or earnings
- Business income
- Investment income (dividends and rent – but not capital gains)
- Interest
- Other income (see the list of all components here)
If you only want to see salary, we have salary by age research too (and a calculator).
Methodology on 2026 United States age & income brackets
This data comes from the United States Census Bureau's ASEC survey. It was released in September 2026.
I then use harmonized data from the University of Minnesota's Minnesota Population Center in R. Citation:
Sarah Flood, Miriam King, Renae Rodgers, Steven Ruggles, J. Robert Warren, Daniel Backman, Etienne Breton, Grace Cooper, Julia A. Rivera Drew, Stephanie Richards, David Van Riper, and Kari C.W. Williams. IPUMS CPS: Version 13.0 [dataset]. Minneapolis, MN: IPUMS, 2025. https://doi.org/10.18128/D030.V13.0
What is your 'worker' screen?
Find the full worker screen methodology in the individual income brackets post.
Income data points and workers by age in 2026
Here's the exhaustive list of data points and the workers they represent for you to make a reasoned call on data quality by age. There are two numbers:
- The samples or number of "data points", the actual number of people in the survey
- The estimated workforce that those data points represent (based on the survey weightings)
| Age | Samples | Estimated Workforce |
| 16 | 538 | 1,111,995 |
| 17 | 823 | 1,805,160 |
| 18 | 992 | 2,272,368 |
| 19 | 990 | 2,527,020 |
| 20 | 1,030 | 3,088,969 |
| 21 | 1,065 | 3,354,879 |
| 22 | 1,086 | 3,525,110 |
| 23 | 1,099 | 3,552,088 |
| 24 | 1,135 | 3,712,801 |
| 25 | 1,258 | 3,971,002 |
| 26 | 1,197 | 3,764,849 |
| 27 | 1,264 | 4,077,061 |
| 28 | 1,315 | 4,180,355 |
| 29 | 1,383 | 4,260,323 |
| 30 | 1,422 | 3,884,282 |
| 31 | 1,464 | 3,950,518 |
| 32 | 1,481 | 3,840,775 |
| 33 | 1,554 | 3,981,624 |
| 34 | 1,659 | 4,333,079 |
| 35 | 1,621 | 4,187,048 |
| 36 | 1,629 | 4,033,519 |
| 37 | 1,582 | 3,816,550 |
| 38 | 1,657 | 4,011,942 |
| 39 | 1,649 | 4,124,729 |
| 40 | 1,695 | 4,023,680 |
| 41 | 1,626 | 3,774,579 |
| 42 | 1,662 | 3,882,063 |
| 43 | 1,654 | 3,833,240 |
| 44 | 1,522 | 3,477,643 |
| 45 | 1,666 | 3,750,149 |
| 46 | 1,571 | 3,645,152 |
| 47 | 1,533 | 3,625,261 |
| 48 | 1,406 | 3,340,044 |
| 49 | 1,425 | 3,327,100 |
| 50 | 1,379 | 3,274,156 |
| 51 | 1,351 | 3,261,585 |
| 52 | 1,249 | 3,053,719 |
| 53 | 1,303 | 3,314,458 |
| 54 | 1,284 | 3,220,643 |
| 55 | 1,294 | 3,349,625 |
| 56 | 1,234 | 3,157,953 |
| 57 | 1,175 | 3,129,593 |
| 58 | 1,091 | 2,885,589 |
| 59 | 1,153 | 3,023,806 |
| 60 | 1,078 | 2,825,855 |
| 61 | 1,117 | 2,930,173 |
| 62 | 1,086 | 2,753,694 |
| 63 | 1,029 | 2,707,514 |
| 64 | 930 | 2,380,060 |
| 65 | 870 | 2,168,892 |
| 66 | 697 | 1,689,591 |
| 67 | 662 | 1,607,786 |
| 68 | 602 | 1,445,118 |
| 69 | 495 | 1,201,412 |
| 70 | 454 | 1,140,651 |
| 71 | 363 | 898,926 |
| 72 | 363 | 846,751 |
| 73 | 299 | 727,588 |
| 74 | 257 | 645,471 |
| 75 | 222 | 538,024 |
Is individual income gross or net?
All income by age numbers in this post are gross income, or before tax. If you are comparing an income make sure it is before any tax is taken out.
Analysis of individual income by age brackets in 2026
This is one of my favorite ways to slice income data. But like the others, it suffers in its complexity. A better way to consume it might be through my companion income percentile by age calculator. There you can filter ages, or compare as many as you like, visually.
