
Below is a stock return calculator which automatically factors and calculates dividend reinvestment (DRIP). Also, you can simulate daily, weekly, monthly, or annual periodic investments into any stock and see your total estimated portfolio value on every date.
Note: The calculator does not account for spin-offs. Split adjustments happen within a week. New listings and ticker changes may take longer.
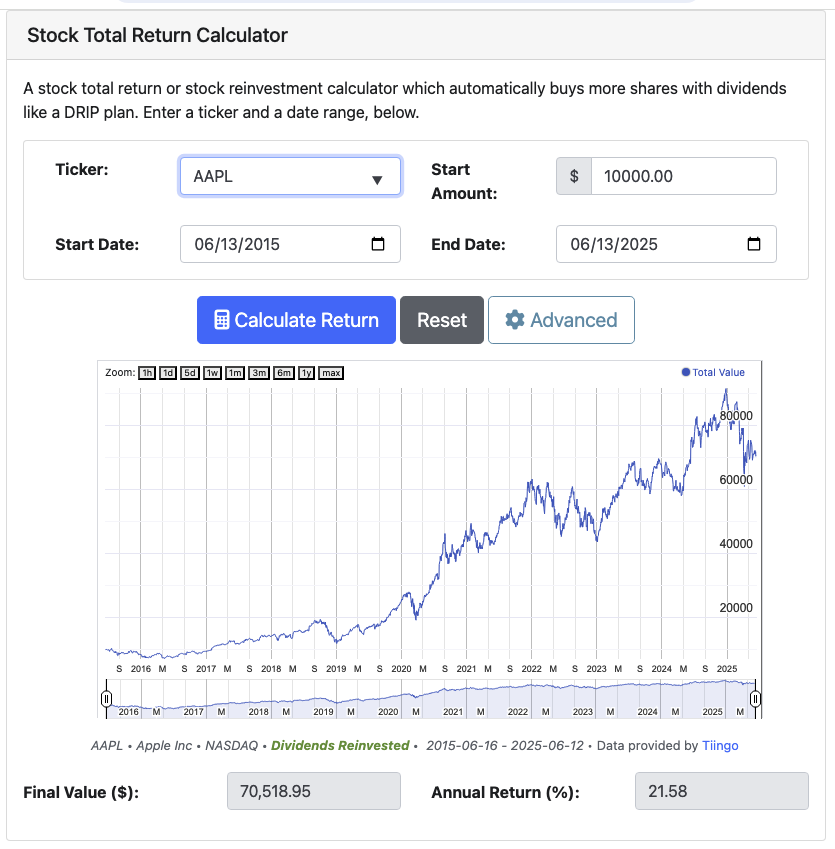
How To Use the Stock Return Calculator
To begin, you need to enter at least a stock ticker. As you type, it will search through legal stock tickers to help you complete the field and explore our set.
Basic Stock Details and Inputs
- Stock Ticker: Enter a valid, active stock ticker [ZIP] from Tiingo. You can also search by company name and the tool should find the ticker, if active and valid.
- Start Amount: Enter an initial investment amount, in dollars
- Start Date: Enter when an investment was first made*
- End Date: Enter when an investment was sold*
° The calculator may adjust the starting and ending dates based on available data. The actual date range used is displayed below the chart after calculation.
Advanced Options
Click the Advanced button to open the advanced stock options panel, allowing you to customize the tool's output.
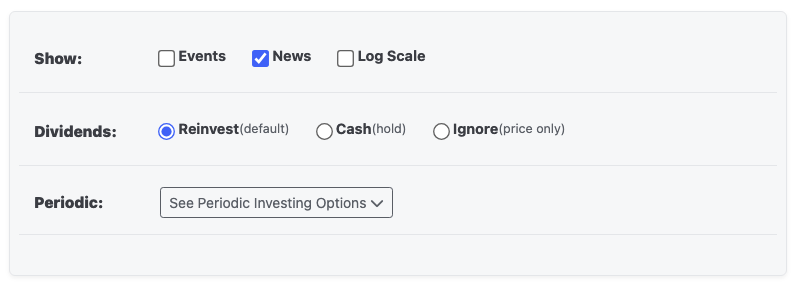
Display Options
- Events: Check the box to display every dividend and stock split event in Tiingo's database for your date range on the chart. (If you enable periodic investments, those will also appear as events. More in the section below.)
- News: Shows relevant financial news articles as markers on the chart, sourced from trusted financial publications including Reuters, Bloomberg, CNBC, Wall Street Journal, and Yahoo Finance. News articles are filtered to show high-quality, relevant financial content.
- Log Scale: Display the chart using a logarithmic scale, useful for viewing long-term growth patterns or large price movements.
Dividend Treatment Options
Choose how dividends are handled in your investment scenario:
- Reinvest (default): Automatically purchases additional shares with dividend payments, simulating a DRIP (Dividend Reinvestment Plan). This is the traditional total return calculation.
- Cash: Holds dividend payments as cash rather than reinvesting. The final results will show both the value of shares owned and total cash dividends received separately. This option reveals an additional breakdown showing Shares Value and Cash Dividends in the results.
- Ignore: Calculates returns based on stock price appreciation only, completely ignoring dividend payments. This shows pure price-only performance.
The dividend treatment method you select is indicated below the chart after you run the tool. Your chosen calculation methodology affects both the final value and the annual return calculations.
Periodic Investments
Simulate dollar-cost averaging by making regular investments over time:
- Enable Periodic Investments: Check this box to activate regular investment simulation
- Frequency: Choose how often to invest: Daily, Weekly, Monthly, or Annually
- Amount: The dollar amount to invest each period
When periodic investments are enabled, each investment appears as an event on the chart (if events are displayed), and the tool calculates returns including the effects of dollar-cost averaging.
Interpreting Portfolio Model Results
- Final Value ($): The total value of the investment on the ending date, including shares and any cash dividends (depending on the dividend treatment you selected)
- Annual Return (%): The annualized percentage return of the investment – matching XIRR methodology – to account for the timing of all cash flows including periodic investments (if you choose to model those).
- Chart: Interactive portfolio value over time. On desktop, you can drag over the graph to see the portfolio value on any specific date. News and dividend events appear as annotations when enabled.
- Dividend Treatment Indicator: Displayed below the chart, this shows which dividend calculation method was used (Dividends Reinvested, Dividends Held as Cash, or Dividends Ignored)
- Date Range: The actual start and end dates used in the calculation, which may differ from your input dates based on data availability and market hours.
Cash Dividend Breakdown
When you select "Cash" for dividend treatment, the results expand to show:
- Shares Value ($): The current market value of shares owned
- Cash Dividends ($): Total dividend payments received and held as cash
This breakdown helps you understand the contribution of dividends versus capital appreciation to your total returns.
How do the periodic stock investments work?
The tool attempts to time dividends based upon the ex-dividend date of stocks in our database. Where the tool sees a dividend, it invests at the daily open price. All other prices in the tool, such as the final portfolio value and daily updates, are based on close price.
When you choose to model periodic investments, the tool invests every 1, 7, 30, or 365 days, respectively. (Read: no accounting for leap years!). Where we register a dividend and investment on the same day, the investment goes in at the open price but (as you'd expect), it doesn't factor into the dividend amount.
Other individual stock resources:
- Stock Drawdown Calculator - See past maximum loss and volatility
- Stock Daily Moving Average Calculator - Equity DMAs and trend periods
- Stock Correlation Calculator - Calculate daily return correlations between tickers
- Investment Calculator - Model future portfolio scenarios and outcomes
Does this tool perform stock valuation?
Remember, "past performance is no guarantee of future results"!
If you see a previously successful investment (actually: especially if you do), don't extrapolate gains to the sky.
Stock valuation is art more than science. Value investors try to model a fair value based on the characteristics of the company – especially accounting for financials and cash flows. Along value lines, we have a few tools for you to attempt to value stocks:
- A Graham Number Calculator which uses Benjamin Graham's method to estimate a fair price.
- A Discounted Cash Flow Calculator which uses estimated future earnings or cash flow growth to estimate the fair value of a stock or investment.
- A Dividend Discount Model Calculator which also estimates net present value like the DCF calculator, but uses dividend history and growth instead.
Or, see industry classification with our SIC and NAICS lookup tool. There are no guarantees in stock valuation - it's hard to predict the future. However, those tools might help point you in the right direction.
Source and Methodology of the Stock Total Return Calculator
The tool uses the Tiingo API on the backend. Tiingo is a paid API provider, so we have some (light) limitations in place:
- Stock data may be up to 7 days old.
- There are rate limits in place for your usage:
- Maximum 50 scenarios per day
- Maximum 10 scenarios per minute
- The tool doesn't – and can't – account for spinoffs
Limitations and Disclaimers
The stock total return calculated is idealized, based on closing prices and unrealistic dividend timing, and will never match exact returns.
The tool is for informational purposes only and we cannot warrant the results. Verify any information you gather from this tool on your own. Treat the stock data as initial research.
We are not modeling taxes, management fees, dividend payment timing, slippage, and other sources of error. It is possible that the dataset contains errors as well.
Bug Reports, feature requests, and requests to help with the Stock Total Return Calculator
Let me know if you find a bug. Include which ticker caused the issue and the timeframe so I can debug.
As for enhancements: outside of ads, I'm not compensated to build and maintain this tool. If you have significant feature requests, make a contracting inquiry.
We wish we could help you with your stock research questions. But this information is for informational and research purposes only. We will not respond to requests to provide investment returns in a legal capacity. We can only help you with research inquiries.
(You probably need a professional known as a "forensic accountant" for legal purposes.)
Musings on the Any Stock Dividend Reinvestment Calculator
We originally built a version of this stock total return calculator for DQYDJ's five year anniversary (and 749th published article). That was in 2014.
Years into the tool (and even more into some of our others) we continue to stress that you need to produce fair, dividend adjusted return comparisons when discussing investments. That's why with this calculator, you choose exactly how you want to handle dividends:
- reinvest them for traditional total return calculations
- hold them as cash to see the separate contribution of dividends and capital appreciation
- ignore them entirely to focus on price-only performance
This flexibility helps you understand the complete picture of investment returns.
I hope you enjoy the stock return calculator. If you see articles quoting price returns on dividend paying stocks – send them our way, deal?
Try comparing your results to one of these (with inflation adjustments turned off):
- Dow Jones Industrial Average Calculator
- ETF and CEF Return Calculator
- S&P 500 Return Calculator
- NASDAQ Return Calculator
- 10-Year Treasury Calculator
- Any House Return Calculator
- Bitcoin Return Calculator
- Mutual Fund Return Calculator
As for styles of investing, we think the best thing to do with a windfall is to invest a lump sum. For investing from your paycheck, we suggest dollar cost averaging. To model a future investment, use the investment calculator.
