
On this page is a Dow Jones return calculator. It allows you to estimate the return contribution of dividends reinvested in the Dow Jones Industrial Average, and you can choose to adjust for inflation.
For last year, see the 2025 Dow Jones Industrial Average return. Next, try our individual stock Graham Number calculator or our individual stock dividend reinvestment calculator. If you want to look at DJIA returns over aggregated periods, this calculator will do the work.
Dow Jones Industrial Average Dividends Reinvested Price Calculator (With Inflation Adjustment)
As we discussed in our dividends reinvested calculator on the S&P 500, a common problem with investment news is the inability of financial journalists to produce fair comparisons for investor returns. Articles often quote returns using only price returns, completely ignoring the very large effect of reinvested dividends on the returns for an average investor.
Not here, though! Here's the key to this calculator:
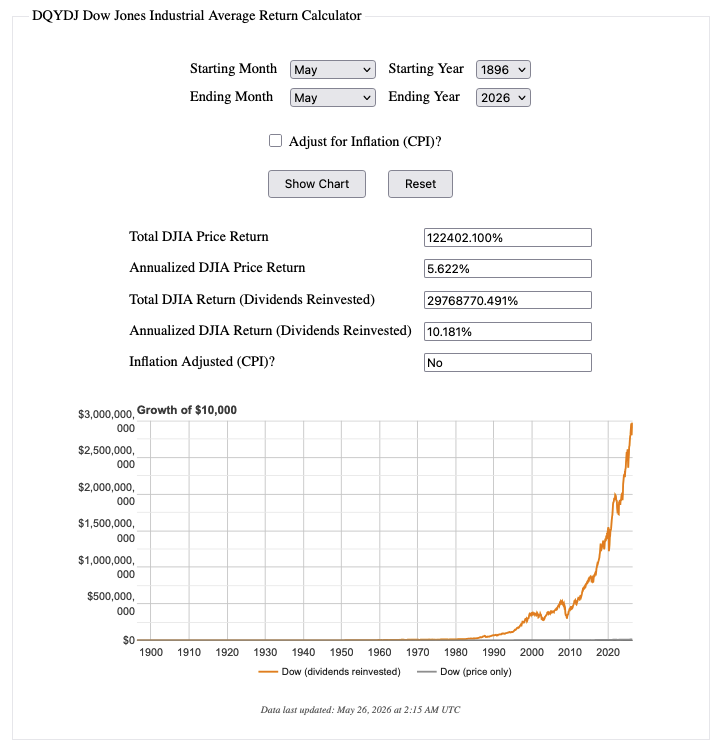
- Total DJIA Price Return – the total price return of the Dow Jones Industrial Average over the period, no dividends.
- Annualized DJIA Price Return – that price return expressed as a return per year.
- Total DJIA Return (Dividends Reinvested) – the total return if you had reinvested every dividend into more of the index.
- Annualized DJIA Return (Dividends Reinvested) – the dividend-reinvested total return, annualized.
- Inflation Adjusted (CPI)? – an informational box telling you whether the most recent scenario was adjusted for inflation (CPI).
Pick any start and end month and the calculator updates as you change it. Click Show Chart to graph the growth of $10,000: the orange line reinvests dividends, the gray line is price only, so the gap between them is the dividend contribution piling up. Tick Log scale for a logarithmic vertical axis, which keeps long, multi-decade windows readable.
Methodology for the Dow Jones Return Calculator
Here's how the tool works:
- 'Month' is an average - the numbers behind the results do not correspond to particular dates, but on monthly average closing prices on the Dow. Think of it like 'average investor' performance had a theoretical investor bought (or sold) in the month you selected. Again, it is not an exact date, there is no exact data in the tool!
- Dividend payouts are approximate - we've made guesses at dividend seasonality by using payout timing on the DIA ETF, payout by months on the S&P 500 (as approximated from Amit Goyal of the University of Lausanne's numbers), and the Cowles Foundation's implied monthly dividend seasonality on their Industrial indexes. In essence, we guessed the percentage of annual dividends paid in each month, then applied that to our data set. Although we truly believe that we are advancing investor education with these derived dividend estimates, it's important to remember they aren't exact. If you think this is insufficient for some reason, please tell us why and let us know how you do it with your calculator.
- Fees are not included - a real investor would likely have paid fees for various things like account maintenance, buying, selling, reinvestment, etc.
- Taxes are not included - considering the proliferation of accounts in the United States which allow taxes to be avoided or deferred, maybe this isn't an issue, but keep that in mind while playing with the calculator.
Dow Jones Industrial Average tool disclaimers
As a disclaimer, this information is for research and educational purposes only. Estimates are derived from multiple sources (listed below) and compiled into the data used in the calculator. We make no guarantees to its accuracy, and you should verify any results with other sources. All numbers are approximations of actual investor performance had the investor reinvested dividends monthly.
Also importantly: we are completely ignoring the drag of fees, taxes, timing, slippage, and the hundreds of other small effects on actual investor performance. None of the data in our calculator matches any exact dividend payout dates nor index closing prices on any individual date.
If you want actual Dow Jones Industrial Average data for other purposes, visit McGraw Hill Financial's S&P Dow Jones Indices, the owner of the Dow Jones Industrial Average (the 30 companies themselves are selected by editors of the Wall Street Journal). Nothing on this page should be construed as investment advice - we're not financial advisors, so please talk over any financial decisions with a qualified advisor.
Before you complain about these limitations, remember Carveth Read's advice (often mis-attributed to John Maynard Keynes): "It is better to be vaguely right than exactly wrong.". For educational purposes, we're happy with how this Dow Jones return calculator turned out.
Sources for the Dow Jones Return Calculator
- McGraw Hill Financial S&P Dow Jones Indices
- Stooq Dow Jones Industrial Average Page
- Cowles Foundation for Research in Economics
- State Street Global Advisors "DIA" ETF (And Prospectuses available on SEC's EDGAR website)
- Amit Goyal's web site
Implications of Dividend Reinvestment
We built this Dow Jones return calculator for educational purposes since it reinforces a powerful point – dividends really do make a huge difference to investor returns! Say we go back and invest $1 in the Dow's very first month – May 1896 – and run the numbers through May 2026:
- If you don't count dividends, you end up with about $1,220. Excellent.
- If you do count dividend reinvestment? Well – it's a whole other ballgame; you end up with roughly $297,000.
So, yes, journalists and others should stop assuming that investors are just throwing their dividend checks in the fireplace. It makes a difference.
For individual investors, also try the ETF return calculator. It automatically does dividend reinvestment.
