
Below you'll find an investment calculator, where you can model the future growth of an investment you own (or are considering owning).
Enter details about the investment, your time-frame, and your planned future contributions to compute – and optionally graph and visualize – your investment. You can also optionally model your loss of purchasing power to inflation and taxes.
Investment Growth Calculator
Using the Investment Calculator
The nice thing about investments is – when they grow, anyway – your interest or unrealized capital gains compound. When you earn a return, it's based on the compounded balance you've made over time. Annual returns are quoted as a geometric average.
This tool loops through all of your planned future investments... or computes returns off a base balance.
Investment Calculator Inputs
To run the tool, first, enter some investment information and how you plan on adding to your balance in the future.
- Current Balance: Enter the amount you currently have in the investment here (or '0' if this is a new investment).
- Years to Invest: How many years you plan to hold – or optionally contribute to – an investment.
- Contribution Amount: The amount you'll contribute every period you select below. If you only want to model growth, enter '0'.
- Contribution Frequency: How often you will invest the above amount in the investment.
Additionally, you'll have to make some future projections. I know; these won't be perfect – but factoring in return and optionally a tax rate and inflation rate will better help you plan your future investments.
- Investment Return Annually: The percentage return you expect this investment to make every year while you own it, on average.
- Inflation: What percentage average annual inflation do you expect in the ensuing years? (To ignore, enter '0').
- Tax Rate: When you withdraw the investment in the future, what marginal tax rate you expect to pay. (To ignore, enter '0').
Once you have those entered, the next section explains how to get a quick result, a graph, and even output your model to a spreadsheet program.
Investment Planning Tool Outputs
There are two modes: a simple, quick result at your total balance or an advanced investment visualization, which you can even choose to output.
Simple Investment Projection Calculation
To see the quick summary, click the blue 'Project Investment' button. You'll quickly see four summary statistics for your scenario:
- Final Balance: In your scenario, the total amount you'd see before you choose to sell and pay taxes.
- Post Inflation/Tax: The total amount you'd have based on paying tax on your gains and adjusting the remaining balance to account for inflation over time (essentially, inflation adjusting to today's dollars).
- Market Gains: Of your final balance, how much came from returns since you were exposed to the market.
- Your Contribution: The amount of your final balance that came from your periodic investments over time.
- Market Gains: Our best guess at market gains over the remaining years in your career.
Advanced Investment Visualization (and Output)
While the summary statistics may be all you need, the tool will let you take it a step (or two) further and visualize your investment growth over time. If you instead select the orange 'Project & Graph' function, the tool graphs your balance at annual intervals and allows you to export the data.
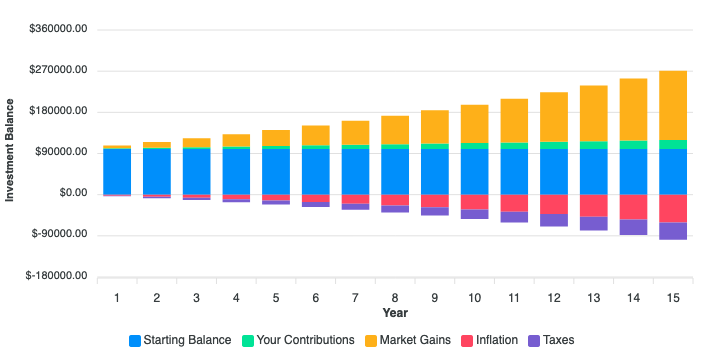
Note: Net balance is computed 'as-if' you sold and paid any taxes that year – consider it your theoretical balance if you stopped early. The final value does not factor in annual sales.
If you click the upper right 'hamburger' menu, you can export the scenario's investment data. Choose svg or png for graphics, or csv to further model in your favorite spreadsheet program.
Investment Calculator Methodology
As I noted in the 401(k) calculator, all projections are wrong... but some are useful. This tool models returns as a smooth graph up and to the right, compounded at the same frequency as whatever investment periodicity you choose.
That will never happen. And neither will you be able to predict the exact tax rate at some future date, nor inflation leading up until then.
Modeling an Uncertain Future in the Investment Calculator
Take the tool's output with a grain of salt – used right (and when you assume errors!), it can help you plan for what the future has in store.
It'll never be perfect. But it can certainly be useful, primarily when you use conservative inputs.
See some other useful tools which will help you decide what's possible (using historical data – not a guarantee of future returns, of course!):
