
On this page is an individual income percentile by age calculator for the United States. Enter age and pre-tax (gross) income earned in full-year 2019 to compare to income distribution by age. Optionally plot income distribution for other ages using the pull-down menu.
(Find the math and methodology in the median, top 1%, and average income by age research post.)
Need a different tool? See our individual income calculator and household income calculator.
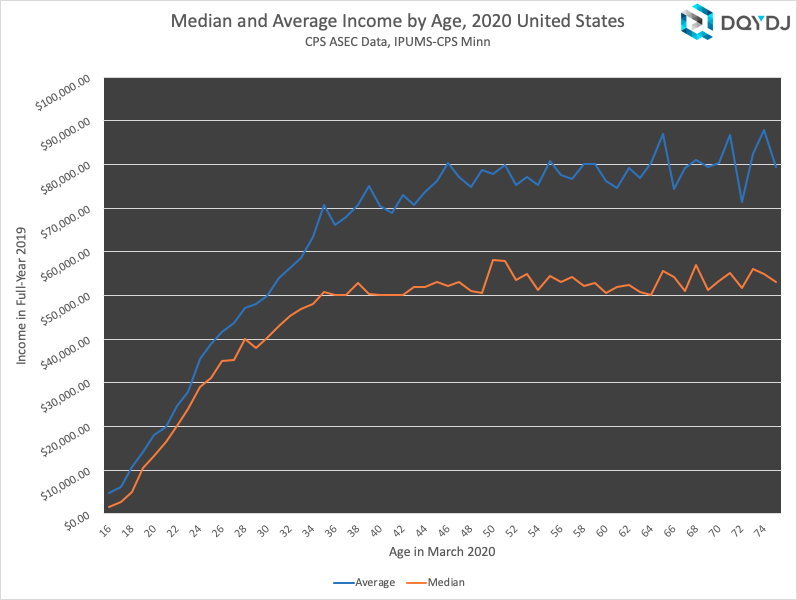
What was the average and median income by age in 2020?
In this chart I've listed the median and average income by age, plus the top 1% by age. For completeness, it also includes the 25%, 75%, and 90% income by age breakpoints.
| Age | Average | 25% | 50% | 75% | 90% | 99% |
| 16 | $4,857.08 | $180.00 | $1,606.00 | $4,532.00 | $12,006.00 | $50,000.00 |
| 17 | $6,087.00 | $720.00 | $2,596.00 | $6,501.00 | $15,241.00 | $60,000.00 |
| 18 | $10,811.61 | $1,200.00 | $5,010.00 | $12,000.00 | $22,000.00 | $77,000.00 |
| 19 | $14,268.26 | $4,000.00 | $10,500.00 | $20,000.00 | $30,000.00 | $80,000.00 |
| 20 | $18,068.59 | $5,011.00 | $13,208.00 | $25,000.00 | $36,303.00 | $100,000.00 |
| 21 | $19,980.30 | $7,550.00 | $16,500.00 | $26,200.00 | $40,000.00 | $98,505.00 |
| 22 | $24,610.08 | $9,000.00 | $20,000.00 | $32,800.00 | $49,521.00 | $132,500.00 |
| 23 | $27,923.02 | $12,000.00 | $24,000.00 | $38,401.00 | $55,000.00 | $111,001.00 |
| 24 | $35,442.22 | $16,011.00 | $29,027.00 | $45,010.00 | $65,065.00 | $153,156.00 |
| 25 | $38,805.53 | $19,742.00 | $31,001.00 | $50,000.00 | $75,500.00 | $164,012.00 |
| 26 | $41,573.27 | $20,810.00 | $35,001.00 | $52,000.00 | $75,322.00 | $190,000.00 |
| 27 | $43,651.03 | $22,500.00 | $35,225.00 | $56,482.00 | $83,581.00 | $168,020.00 |
| 28 | $47,116.26 | $22,416.00 | $40,000.00 | $60,000.00 | $85,000.00 | $184,015.00 |
| 29 | $48,052.90 | $22,000.00 | $38,005.00 | $60,710.00 | $92,010.00 | $212,200.00 |
| 30 | $49,813.00 | $24,000.00 | $40,210.00 | $64,310.00 | $93,395.00 | $210,000.00 |
| 31 | $53,985.68 | $25,001.00 | $42,900.00 | $68,005.00 | $102,858.00 | $220,300.00 |
| 32 | $56,277.11 | $26,400.00 | $45,301.00 | $70,111.00 | $100,993.00 | $257,426.00 |
| 33 | $58,510.95 | $27,000.00 | $47,000.00 | $70,051.00 | $105,190.00 | $280,925.00 |
| 34 | $63,419.60 | $30,000.00 | $48,100.00 | $75,168.00 | $120,000.00 | $301,101.00 |
| 35 | $70,756.02 | $30,000.00 | $50,800.00 | $81,880.00 | $131,300.00 | $403,800.00 |
| 36 | $66,184.89 | $30,000.00 | $50,005.00 | $82,602.00 | $128,601.00 | $300,002.00 |
| 37 | $68,000.20 | $30,000.00 | $50,011.00 | $81,110.00 | $130,004.00 | $341,403.00 |
| 38 | $70,595.52 | $30,000.00 | $52,914.00 | $84,005.00 | $130,800.00 | $355,727.00 |
| 39 | $75,126.34 | $29,963.00 | $50,420.00 | $85,040.00 | $140,046.00 | $505,002.00 |
| 40 | $70,361.07 | $26,050.00 | $50,135.00 | $88,000.00 | $142,600.00 | $363,002.00 |
| 41 | $68,832.01 | $29,056.00 | $50,001.00 | $86,016.00 | $134,006.00 | $350,615.00 |
| 42 | $72,988.01 | $28,000.00 | $50,100.00 | $87,705.00 | $144,811.00 | $448,801.00 |
| 43 | $70,697.39 | $30,000.00 | $52,000.00 | $84,046.00 | $135,536.00 | $408,000.00 |
| 44 | $73,767.73 | $30,000.00 | $52,000.00 | $86,000.00 | $141,567.00 | $469,250.00 |
| 45 | $76,259.75 | $30,000.00 | $53,002.00 | $90,508.00 | $145,000.00 | $445,000.00 |
| 46 | $80,341.51 | $30,100.00 | $52,200.00 | $90,000.00 | $154,002.00 | $550,554.00 |
| 47 | $77,027.66 | $30,460.00 | $53,000.00 | $90,150.00 | $150,000.00 | $508,962.00 |
| 48 | $74,857.84 | $30,911.00 | $51,023.00 | $90,009.00 | $149,031.00 | $438,300.00 |
| 49 | $78,727.78 | $28,150.00 | $50,651.00 | $93,029.00 | $150,000.00 | $526,500.00 |
| 50 | $77,722.23 | $32,100.00 | $58,000.00 | $93,520.00 | $140,025.00 | $455,000.00 |
| 51 | $79,916.72 | $32,002.00 | $57,811.00 | $97,288.00 | $154,002.00 | $413,592.00 |
| 52 | $75,356.31 | $30,000.00 | $53,520.00 | $92,601.00 | $150,020.00 | $451,701.00 |
| 53 | $77,085.29 | $31,756.00 | $55,000.00 | $93,000.00 | $151,550.00 | $455,002.00 |
| 54 | $75,330.73 | $28,920.00 | $51,200.00 | $91,210.00 | $150,000.00 | $490,165.00 |
| 55 | $80,704.96 | $30,000.00 | $54,510.00 | $90,100.00 | $151,500.00 | $495,530.00 |
| 56 | $77,538.51 | $30,000.00 | $53,100.00 | $96,002.00 | $151,010.00 | $403,000.00 |
| 57 | $76,589.06 | $30,002.00 | $54,305.00 | $90,250.00 | $150,145.00 | $453,151.00 |
| 58 | $80,139.46 | $31,510.00 | $52,200.00 | $90,010.00 | $156,205.00 | $592,200.00 |
| 59 | $80,049.82 | $30,000.00 | $52,800.00 | $90,768.00 | $170,600.00 | $432,655.00 |
| 60 | $76,205.24 | $29,232.00 | $50,517.00 | $89,200.00 | $155,001.00 | $510,000.00 |
| 61 | $74,589.16 | $30,000.00 | $52,006.00 | $90,300.00 | $151,500.00 | $314,000.00 |
| 62 | $79,062.50 | $30,004.00 | $52,500.00 | $90,203.00 | $152,718.00 | $500,001.00 |
| 63 | $76,812.37 | $30,000.00 | $50,760.00 | $90,063.00 | $157,995.00 | $443,175.00 |
| 64 | $80,326.20 | $29,232.00 | $50,050.00 | $91,320.00 | $167,000.00 | $500,074.00 |
| 65 | $86,932.04 | $30,905.00 | $55,600.00 | $101,050.00 | $175,445.00 | $565,707.00 |
| 66 | $74,346.57 | $31,905.00 | $54,270.00 | $89,122.00 | $147,034.00 | $335,000.00 |
| 67 | $79,212.00 | $32,340.00 | $51,000.00 | $90,636.00 | $155,110.00 | $523,752.00 |
| 68 | $81,059.23 | $31,245.00 | $57,000.00 | $97,113.00 | $159,268.00 | $423,481.00 |
| 69 | $79,342.86 | $31,936.00 | $51,226.00 | $97,092.00 | $160,870.00 | $344,700.00 |
| 70 | $80,420.36 | $32,200.00 | $53,354.00 | $89,260.00 | $160,000.00 | $363,088.00 |
| 71 | $86,760.99 | $30,750.00 | $55,165.00 | $102,174.00 | $182,349.00 | $565,480.00 |
| 72 | $71,355.26 | $30,000.00 | $51,600.00 | $82,846.00 | $154,177.00 | $333,690.00 |
| 73 | $82,354.64 | $30,999.00 | $56,002.00 | $91,853.00 | $164,035.00 | $472,070.00 |
| 74 | $87,842.49 | $30,002.00 | $54,907.00 | $87,000.00 | $174,550.00 | $583,956.00 |
| 75 | $79,290.20 | $28,032.00 | $52,980.00 | $89,861.00 | $184,511.00 | $408,261.00 |
Yes, the data is noisy. The source post has some of the explanation, but the takeaway is we can't be perfectly sure of the income breakpoints for smaller groups, like those based on ages. To get a "feel" for a point, look a few percentiles north and south, as well as looking at other ages.
You can see here how the average and median are "bumpy" due to this effect – but you do get a clear trendline:
How many workers make $100,000 by age? How many workers make $250,000?
$100,000 and $250,000 are common cutoffs for "high" income. Yes, I know – geography makes a huge difference (see our income by state and income by city posts). Either way, they are useful thresholds for seeing income distribution across ages:
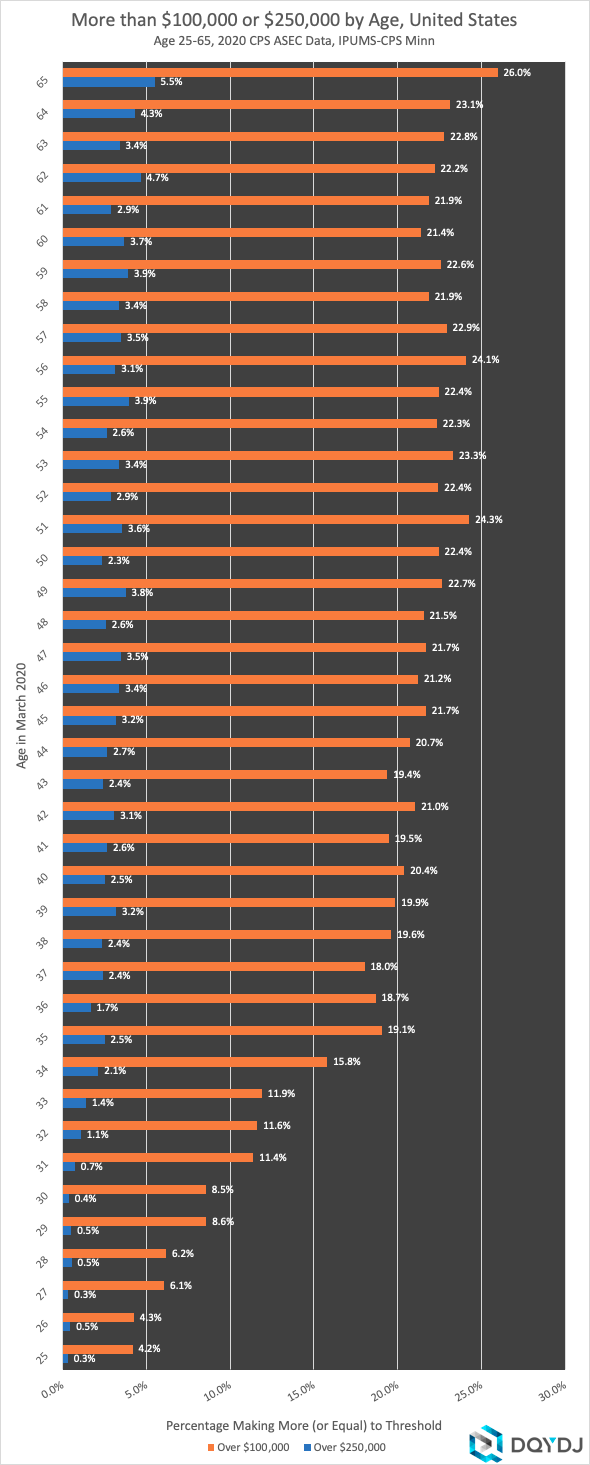
Note: this is "percentage of workers of a certain age", so especially beyond age 60 it interacts with retirement age. You can cross this with our estimated worker count by age to get an estimated absolute number.
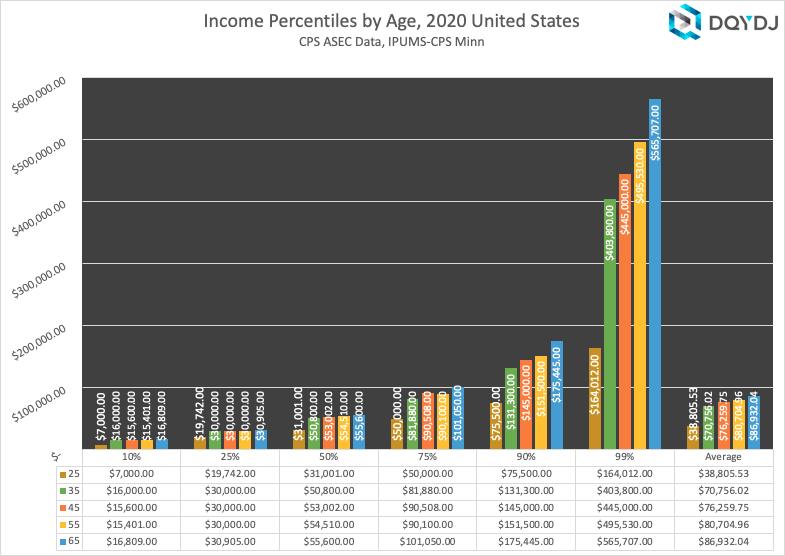
Average, Median and Selected Income Percentiles for Ages 25-65
This next graph shows selected income percentiles for certain ages: 25, 35, 45, 55, and 65.
Source and Methodology on the 2020 Individual Income Percentile by Age Calculator
Sarah Flood, Miriam King, Renae Rodgers, Steven Ruggles and J. Robert Warren. Integrated Public Use Microdata Series, Current Population Survey: Version 7.0 [dataset]. Minneapolis, MN: IPUMS, 2020. https://doi.org/10.18128/D030.V7.0
Our "worker" methodology matches the 2020 individual income bracket post. Total income comes from many sources: here's a list.
To see the number of data points and estimated number of workers by age, see the income by age post. To narrow to just wage income, see the salary percentile by age calculator.
Individual Income Percentile by Age Calculators for Past Years
To see past editions of the income percentile by age calculator, here are the archives:
- 2019 US Individual Income by Age Calculator
- 2018 US Individual Income by Age Calculator
- 2017 US Individual Income by Age Calculator
- 2016 US Individual Income by Age Calculator
- 2015 US Individual Income by Age Calculator
- 2014 US Individual Income by Age Calculator
- 2013 US Individual Income by Age Calculator
Want more? Also see our net worth calculator and net worth by age calculator.
