
In this post, we’ll look at the United States Net Worth Brackets for 2016 (data survey is a snapshot from March, 2016). We include wealth brackets for selected percentiles, average, median, and a special section zooming into the net worth of the top one percent
After: check out our net worth percentile calculator and net worth by age calculator.
Selected Net Worth Brackets and Percentiles for the United States in 2016
There were 126.0 million households in the United States (Federal Reserve estimate) in Full-Year 2016.
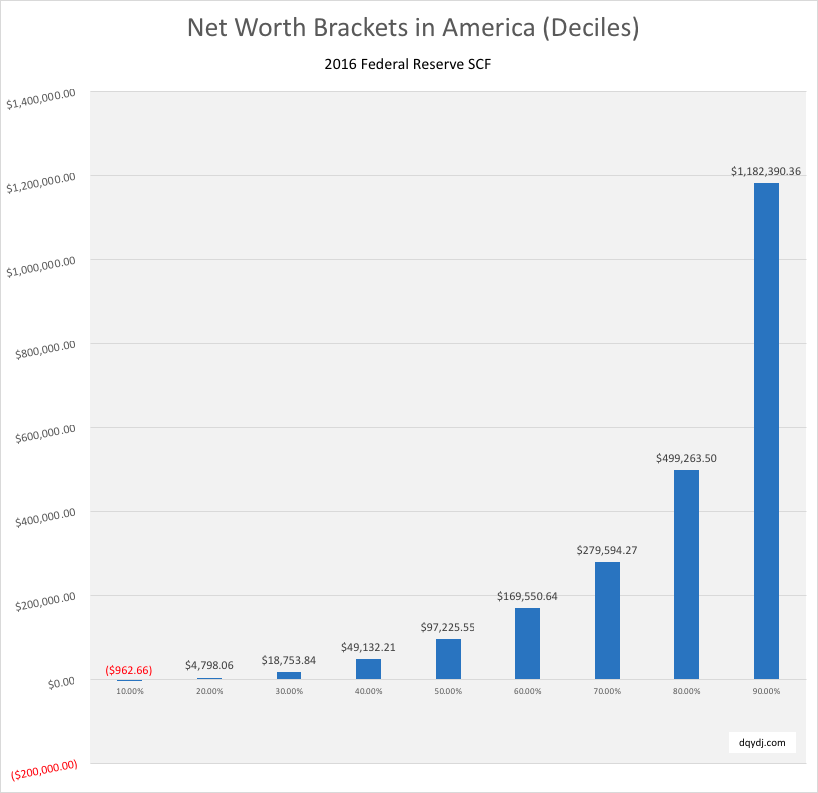
For selected percentiles, the following are the net worth brackets and breakpoints:
| Net Worth Percentile | Net Worth |
| 10.0% | -$962.66 |
| 20.0% | $4,798.06 |
| 30.0% | $18,753.84 |
| 40.0% | $49,132.21 |
| 50.0% | $97,225.55 |
| 60.0% | $169,550.64 |
| 70.0% | $279,594.27 |
| 80.0% | $499,263.50 |
| 90.0% | $1,182,390.36 |
| 95.0% | $2,377,985.22 |
| 99.0% | $10,374,030.10 |
Dollar estimates are the actual net worth quantile breakpoint – the 'border' between two wealth percentiles.
For example, if someone had exactly $279,594.27 in wealth we'd estimate they are the 70th percentile.
Average, Median, Top 1% and Selected Net Worth Percentiles
There is a very large distribution of net worth between the wealthiest and poorest households. Let's look at a subset of brackets and summary statistics so you can get a feel for net worth disparity in America.
What is the average net worth in the United States?
The average net worth is $692,100. The median net worth is $97,300.
Who are the top 1% by net worth?
In 2016, we estimate that you need $10,374,030.10 in wealth to be in the top one percent. To be in the top 10%, you'd need $1,182,390.36. Here's a look at our estimates for the wealth of the top one percent in the United States in 2016:
| Net Worth Percentile | 2016 Dollar Cutoff |
| 90.0% | $1,182,390.36 |
| 95.0% | $2,377,985.22 |
| 99.0% | $10,374,030.10 |
| 99.5% | $16,115,373.00 |
| 99.9% | $43,090,281.00 |
For the top .5% and .1% note that our estimates are hazier - consider our 95% confidence interval to be over a million dollars in either direction. Again, though, the .5% and .1% estimates are in the right ballpark of Emmanual Saez and Gabriel Zucman’s estimates for 2012 with four years of growth in between.
What is the Net Worth to be Wealthy?
Depending on where you live, a net worth of around $2,500,000 is wealthy. This is around the top 5% of all households in net worth, and can sustain around $100,000 in spending for 30 years.
What is Net Worth?
Net worth is a snapshot of value if you cancel out a household's assets and debts. You can calculate your own if you add up all your assets – home to cars to accounts – and subtract your debts – mortgage, student loans, and the like.
To calculate it here, we take all assets a person listed in the survey, then subtract and debts. There is no provision for liquidity (how easy it would be to spend) here – read more in our savings by age article.
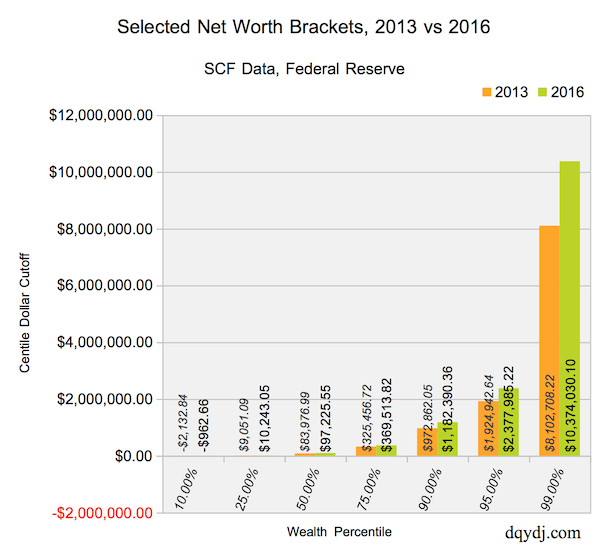
Net Worth Comparison of 2016 and 2013
We've selected some important net worth percentages for 2016 and 2013 (released 2017 and 2014, respectively). This data comes from 2017 Federal Reserve Surveys of Consumer Finances, and surveys were first conducted the previous year.
Stated simply, data is from wealth snapshots at "sometime" in 2016 and 2013, respectively.
If you'd like more exact monetary statistics, try our individual income percentile calculator, and stats on income brackets and the top 1%.
There is a lot to like in the distribution itself.
Unlike the recent income percentile breakdown, every Wealth Bracket saw an improvement between 2013 and 2016. That's right - across the board, at a percentile resolution, the wealth dollar breakpoint for all net worth brackets increased.
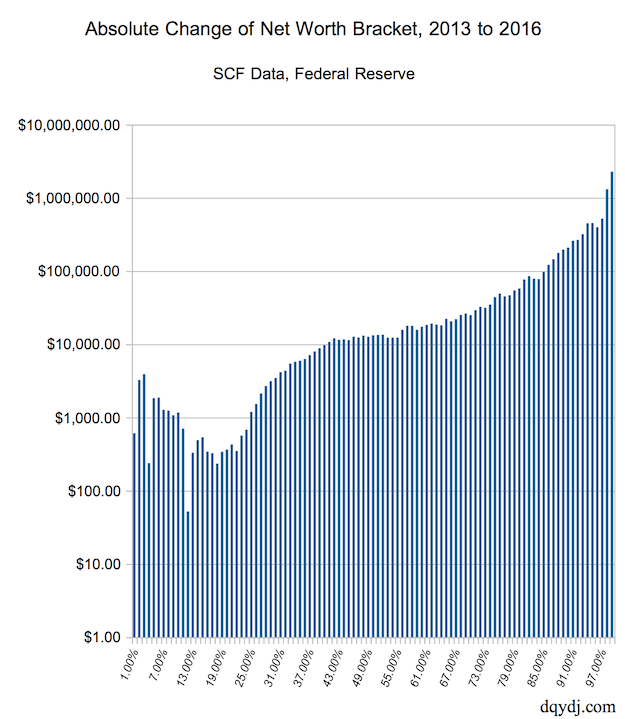
The above chart is a log scale; here are the absolute changes for the top 5% of wealth brackets:
| Net Worth Percentile | 2013 SCF | 2016 SCF | Change in Breakpoint | Increase |
| 95 | $1,924,942.64 | $2,377,985.22 | $453,042.58 | 23.54% |
| 96 | $2,401,849.00 | $2,798,189.12 | $396,340.12 | 16.50% |
| 97 | $3,185,849.01 | $3,703,775.80 | $517,926.79 | 16.26% |
| 98 | $4,506,369.69 | $5,816,220.17 | $1,309,850.48 | 29.07% |
| 99 | $8,102,708.22 | $10,374,030.10 | $2,271,321.89 | 28.03% |
Net Worth Based Accredited Investors in America
To invest in angel and private equity funds, venture capital, hedge funds, , and other private placements an investor is required to be an 'Accredited Investor'. In the US, having net worth of $1,000,000+ not including primary home equity is the most common way to qualify.
There are roughly 12.4 million accredited investor households, and around 11.3 million qualify through net worth. Investors can also qualify through individual or household income.
See the math on the number of accredited investors in America.
Methodology for 2016 United States Net Worth Brackets
Data for this article comes from the 2013 and 2016 Surveys of Consumer Finances from the Federal Reserve. Special thanks is owed to Anthony Damico for his lodown package for R, which we are using to analyze the 2013 and 2016 datasets. Please see his Analyze Survey Data Free book which details SCF analysis and more in R.
As mentioned, the Federal Reserve estimates a representative size of 125,981,700 United States households for this survey. The 2016 survey includes 6,254 families in the private dataset. The public dataset removes 6 families (leaving 6,248) for privacy purposes. The Fed sweeps data for privacy by releasing 'separate' datasets with replicate weights for all the variables. Our estimates are using the linear interpolation algorithm in the svyquantile function from the R survey package.
See the Analyze Survey Data book for more information; for going beyond the data you see it's worth pulling down the dataset on your own.
Other notes: net worth does not include periodic income streams such as pensions or Social Security. Perhaps a future article will attempt to account for these; watch this space, if we model income streams as net worth in the future we'll link out.
Please note the data is not longitudinal. In short, that means the surveys aren't answered by the same families in 2013 and 2016.
It’s impossible to draw specific conclusions on the net worth changes for households in 2013 households. It is, however, possible to see how the static snapshot of net worth distribution changes (or, as the case may be, for inequality measures).
Conclusions on United States Net Worth Brackets for 2016
It's heartening to see the across the board improvements in every net worth bracket from 2013 to 2016. While the broadest gains went to the top centiles, we saw improvement all over the net worth distribution. Let's hope for an even greater improvement in 2019.
We're big fans of net worth - it's the most important number to track for your finances. To make it easy, try the free tool Personal Capital to keep an eye on your debts and assets.
Now that you've seen the static shot, try comparing with the data dynamically. Try our American net worth percentile calculator and net worth by age calculator. You can also check out income in America for everyone or by age.
