
This page contains a net worth percentile calculator for the household wealth distribution in the United States in 2016 (2020 wealth calculator is here). Enter a current net worth for a net worth percentile estimate to the closest .5%.
After: see percentiles by age in the net worth by age calculator. Prefer income? Try income or income by age.
Net Worth Percentile Calculator for the United States
Average, Median, Top 1% and Selected Net Worth Percentiles
While you can get all this information from the tool, it's useful to analyze selected net worth summary statistics. By seeing average net worth, median, net worth, the top one percent and others you get a better idea of the United States Wealth distribution.
You can also see a more extensive examination in our net worth brackets article. Let's dig in.
What is the average net worth in the United States? What is the median net worth?
In the United States, the average net worth per household is $692,100. The median net worth per household is $97,300.
Who are the top one percent in America by net worth?
Net worth of over $10,374,030.10 would put a household in the top 1%.The top 1% is roughly the wealthiest 1,259,817 households in America.
Note that The 1%, usually refers to the top 1% of income earners in the United States. We're prefer to use net worth – it's easy to convert net worth to income but not always vice versa.
Who are the top .1% by net worth?
Please note that it is probably a couple million dollars away in either direction from the 'true' value. Data is sparse at this level.
- Roughly 125,981 households have the top .1% of net worth.
- More than $43,090,281.00 in wealth would put a household in the top .1% with 2016 data.
Please also see our article on the one percent in net worth and income in America where we discuss the question in finer detail.
Net Worth Deciles in the United States
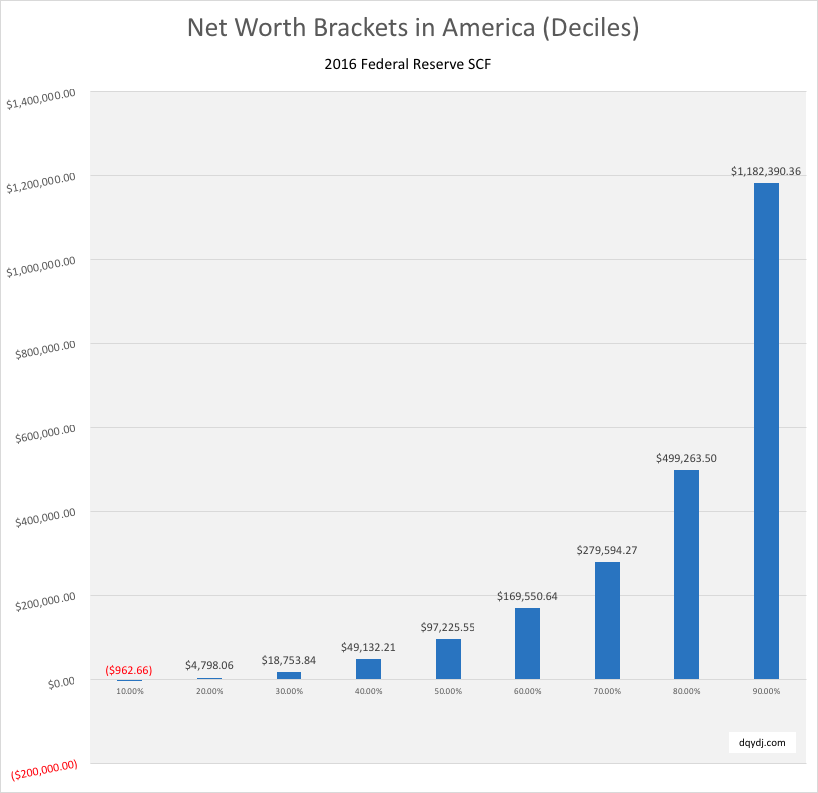
Here is the net worth break-point for households in America at every decile:
| Net Worth Percentile | Net Worth |
| 10.00% | -$962.66 |
| 20.00% | $4,798.06 |
| 30.00% | $18,753.84 |
| 40.00% | $49,132.21 |
| 50.00% | $97,225.55 |
| 60.00% | $169,550.64 |
| 70.00% | $279,594.27 |
| 80.00% | $499,263.50 |
| 90.00% | $1,182,390.36 |
What is Net Worth?
Net worth is the ultimate number to track for your personal finance. Net worth is your total value if you sold everything and paid off all of your debts. Tracking your net worth over time will put you on the road to financial independence or retirement.
How do you calculate your net worth?
To calculate net worth, add up the value of every single one of your assets. Next, subtract the sum of all of your debts.
The result is your net worth. With that net worth in hand, compare yourself to the net worth of other Americans on this page.
Simplify the net worth tracking process by trying the free tool Personal Capital. They'll automatically calculate your assets and debts and even have a retirement planning calculator to project future wealth.
How Many Households Have Between $1,000,000 and $2,000,000 in Net Worth? (Or Other Boundaries)
We've built an estimate of the number of households between net worth thresholds directly into the tool. You can get a rough cut of any two numbers you'd like simply by subtracting or multiplying. Let's do it together for households between $1 million and $2 million in net worth:
- $1,000,000 in wealth is near the 88% in America. Around 15,117,804 households matched this bracket or more.
- $2,000,000 in wealth is around the 93.5% in America. Around 8,188,810 households or so matched this net worth or more.
There are two ways to compute the rough number of households:
15,117,804 - 8,188,810 = Roughly 6,928,994 households in America have between $1,000,000 and $2,000,000 in wealth. (call it 7,000,000)
OR
93.5% - 88% = 5.5%.
5.5% * 125,981,700 = 6,928,993.5 or 6,928,994 households.
If you're interested in millionaire research, see our post on the number of millionaires in America. We look at millionaires, decamillionaires and many more breakdowns of this wealth data.
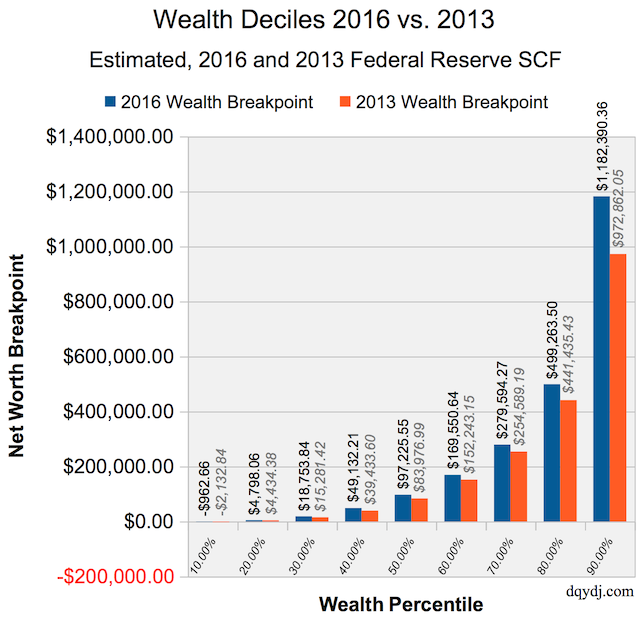
Differences Between 2016 and 2013 Net Worth Data in the United States
The data is perfectly comparable to the 2013 SCF data, and we're happy to report that every single net worth bracket increased in wealth over the three years between surveys. Be careful not to draw improper conclusions - the data is not longitudinal, so we can't state with certainty that individual households improved. However, the static data shows an improvement at every breakpoint.
Here's the improvement at every wealth decile versus the 2013 wealth percentile calculations:
| Net Worth Bracket | 2016 Wealth Breakpoint | 2013 Wealth Breakpoint | Difference |
| 10.00% | -$962.66 | -$2,132.84 | $1,170.18 |
| 20.00% | $4,798.06 | $4,434.38 | $363.68 |
| 30.00% | $18,753.84 | $15,281.42 | $3,472.42 |
| 40.00% | $49,132.21 | $39,433.60 | $9,698.60 |
| 50.00% | $97,225.55 | $83,976.99 | $13,248.56 |
| 60.00% | $169,550.64 | $152,243.15 | $17,307.49 |
| 70.00% | $279,594.27 | $254,589.19 | $25,005.08 |
| 80.00% | $499,263.50 | $441,435.43 | $57,828.07 |
| 90.00% | $1,182,390.36 | $972,862.05 | $209,528.31 |
Here's the same information in easy-to-share graph format:
Accredited Investors in America Based on Net Worth
To invest in private equity funds, angel funds, venture capital, hedge funds, , and other types of private investments an investor needs to be an Accredited Investor. In America, the most common way to qualify is through net worth, having a net worth of $1,000,000 not including equity in a primary residence.
We estimate that of the ~12.4 million accredited investor households, around 11.3 million qualify just through the net worth criteria. Investors can also qualify through individual or household income.
Here is our math on the number of accredited investors in America.
Similar Tools and Research
- See our millionaires in America article.
- See our analysis in the net worth bracket article.
- To divide by age, see the net worth percentile by age calculator.
- To rank income, try the individual income calculator.
- Or to divide income by age, use the individual income by age calculator.
Source and Methodology on the Net Worth Percentile Calculator for 2016
Our data comes from the 2016 Federal Reserve Survey of Consumer Finances. It encompasses 6,248 actual American households in the public set. Those households are spread across 5 sets with replicate weights, and weight to 125,981,700 households. We turn this into 200 quantiles, so wealth is estimated to the half percentage. See our article on wealth brackets for more details on methodology.
Net worth numbers come from the Federal Reserve's provided macro. We also make estimates ignoring primary home equity by taking the estimated value of the primary residence and subtracting from it all debts secured by the residence. This includes mortgages, home equity loans, and similar.
Note: remember that if you sell a primary residence you still need to pay rent. We aren't fans of this calculation method but we heard your arguments and built it into the tool.
A note on accuracy: SCF data is self-reported and is presented to you today as the result of a complex survey design. The survey data includes a warning: "[B]ecause detailed information on the sample design cannot be released, and because of the complexity of the SCF design, users cannot apply some of the standard procedures for variance estimation."
For research, information and estimation purposes, you can trust the numbers you see. For anything where you need more detail, run the numbers or go knock on some doors yourself.
