
Earlier, we looked at the correlation of income and net worth for all American households in 2016. In this post, we'll look at the correlation for well-off or upper middle class households.
What's the correlation of net worth and income for affluent households and millionaires?
- The correlation of net worth and income for households making $100,000 or more was .4967, or an R^2 of .2467.
- For households with $1,000,000 or more in net worth, the correlation was even lower at .4745 or an R^2 of .2252.
As was the story with all households, net worth isn't reasonably predicted by income for upper middle class households.
The Correlation of Net Worth and Income for Households Making Over $100,000
For our first definition of upper middle class we used a household income of $100,000 or more. Although arbitrary, there is still cachet to the so-called six-figure income.
It's both a psychologically important number and (conveniently) an obvious tick mark on a log base 10 graph. Here's what our plot looks like:
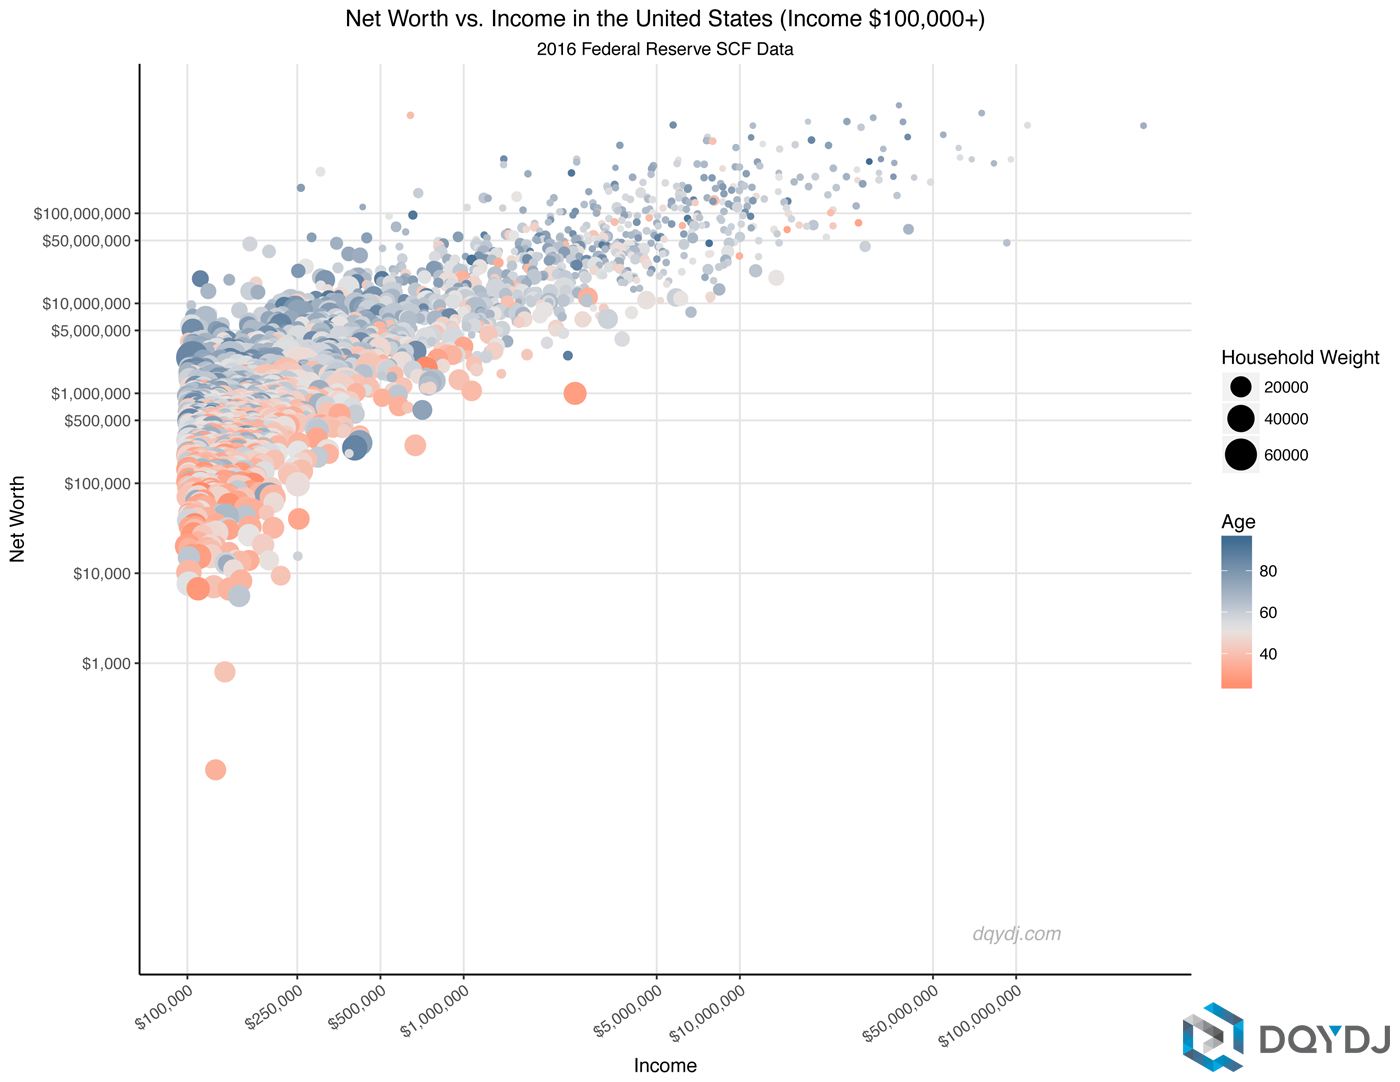
As you can see from our household income percentile calculator, it's a fairly high benchmark to clear.
Making $100,000 would put a household at roughly the 70% income bracket for in 2018 (although the SCF data - from 2016 - estimates closer to 75.6%). Regardless, there are a wide range of reported household net worth numbers in narrow income bands.
Visually, you can see there is a positive correlation between the two at this income level, but remember the scale is logarithmic.
The data reveals that for the 3.5% of respondents making between $100,000 and $110,000, net worth spanned from somewhere around -$2 million to +$10 million!
The Correlation of Net Worth and Income for Households With Net Worth Over $1,000,000
Once again, blame the power of the phrase "millionaire" for lending us the next definition for the upper middle class. Having a million dollars in net worth (and earning that second comma) is still an excellent benchmark in the 2010s.
Of course, we've also argued that often a million dollars isn't enough...
Still, a million bucks is as good a place to cut the data as any. Here's how it looks on a log base 10 scale:
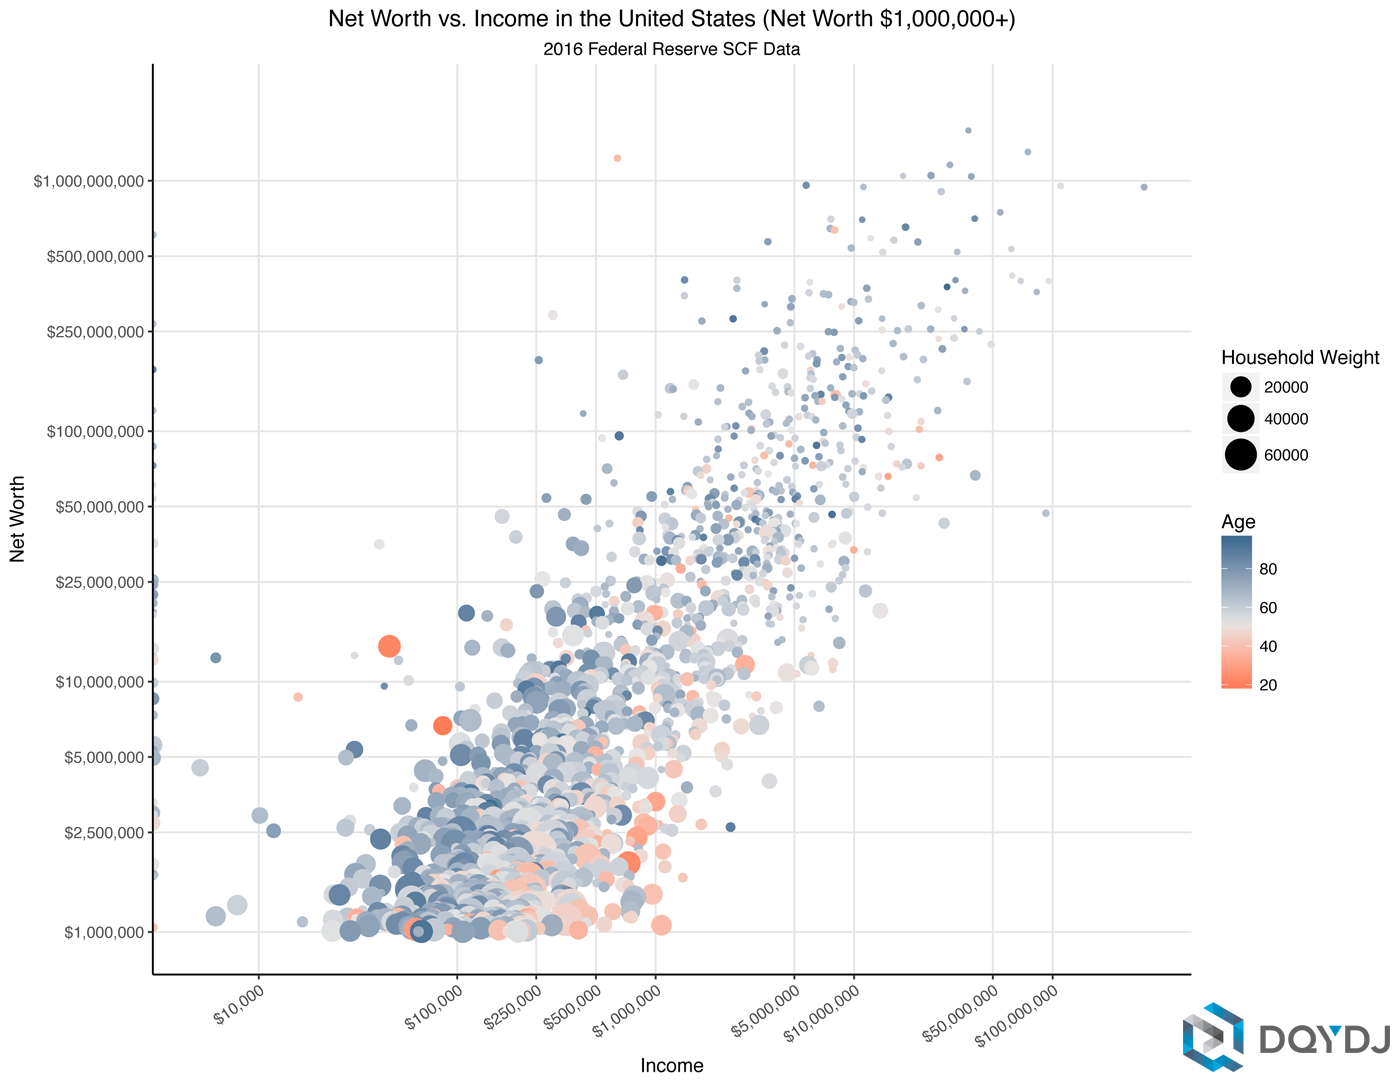
As above, you can get a look at household net worth percentile calculations, or skip to our article on millionaires in America. Millionaire status is even more exclusive than the first cut; we estimate it was the 88.2% wealth percentile for American households.
Further, 3.9% of households reported between $1,000,000 and $1,500,000 in net worth. Their household income? It varied roughly between $0 and $1,069,261.
So once again, using income to predict net worth here falls flat.
If there's something more to be said, it's that the chart has a great spread. You can visually tease out that age comes into play here.
The orange points (younger millionaires) do seem to have higher incomes to make the screen, while the bluer points (older millionaires) are all over the map. Further, there are many more older millionaires than younger millionaires.
Source on the Correlation Of Income and Net Worth for the Upper Middle Class
As per tradition, we started with the 2016 SCF Data from the Federal Reserve. For the details of how we divided the responses, see the previous post in the series. After that, we split the data points with the filters described in this post.
Net Worth, Income, and the Upper Middle Class
Unfortunately, solely using income to predict net worth doesn't cut it for affluent or wealthy households. These are still separate enough concepts, and for any net worth model you'd consider building you need to add additional variables to better predict a household's net worth.
Millionaires could be retired or had lowered income in 2016 versus a previous year. Perhaps they even inherited their wealth. On the $100,000+ income side, in any given six-figure household the members might be in debt or be wholly financially dependent.
