
A few weeks back we ran an article that you all seemed to love about how much Americans spend on food. We here at DQYDJ recognize that food isn't the only thing Americans consume - many Americans also drink alcohol and smoke cigarettes and cigars.
Perhaps you're one of those Americans? Here's how you stack up to your peers in 'sin' spending!
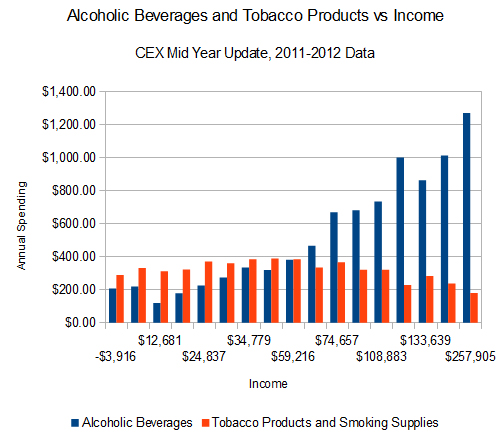
The interesting observation for this chart? Unlike with food spending, spending on tobacco actually decreases as household income increases. Somewhere between $35,000 and $60,000 tobacco usage (or purchasing, anyway) maxes out and starts a slow decline, to the point that households making over $250,000 spend less on tobacco than any other income group. We've come a long way since The Great Gatsby.
I know I gave you folks hard numbers on our food spending (we were off the charts, haha), but I don't have personal data on tobacco and alcohol. It's not that we abstain from everything, it's just that other than the bar trips, our alcohol spending is mixed in with our grocery spending. The only tobacco I have on site is contained in my humidor - and I rarely will touch the cigars, except, perhaps, to (hilariously) peer pressure overly drunk guests to light one up.
If we were over for food spending, we're under for 'sin' spending.
How We Calculate Alcohol and Tobacco Spending Per Month
We crunched the numbers given to us by the BLS’s semi-annual Consumer Expenditure Survey. In that survey, respondents self-report the amount that they spend on a large number of categories, among them spending on eating out and on eating at home. They make the microdata available, but we use the ‘average after tax income’ reported in the survey, find a curve of best fit, and use that equation to give you this nifty little tool. We used the earl 2013 release, not the mid-year release that just came out - although the mid-year release produced the chart you see above.
Just like the last one, you'll lose a lot of resolution near the top - $257,905 is our top data point, so I assume the data breaks down.
Also unlike with the food spending article, I think (hope? pray?) this data doesn't really matter much based on household size. I made no value judgements about food spending, but it's probably better if you don't buy booze and cigarettes for your under 18 year old children.
How do you stack up in the 'sin' categories? Is this interesting data? Did you expect to see the curve in tobacco spending?
