
Welcome to our Mutual Fund Daily Moving Average Calculator. This tool enables you to examine two customizable daily moving averages for a mutual fund across a timeframe of your choice. You can visualize these averages on a chart and identify important crossover points. Our database covers thousands of mutual funds, with data refreshed weekly.
Here's a guide to help you make the most of this mutual fund analysis tool:
- Fund Symbol: Input the mutual fund's ticker symbol. As you type, the tool will suggest matching symbols to assist you.
- First MA Period (Days) / Second MA Period (Days): Specify the durations for your two moving averages. Common choices include 50 and 200 days, but feel free to experiment with different combinations.
- Analysis Start Date: Choose the beginning date for your moving average analysis.
- Analysis End Date: Select the final date for your analysis period.
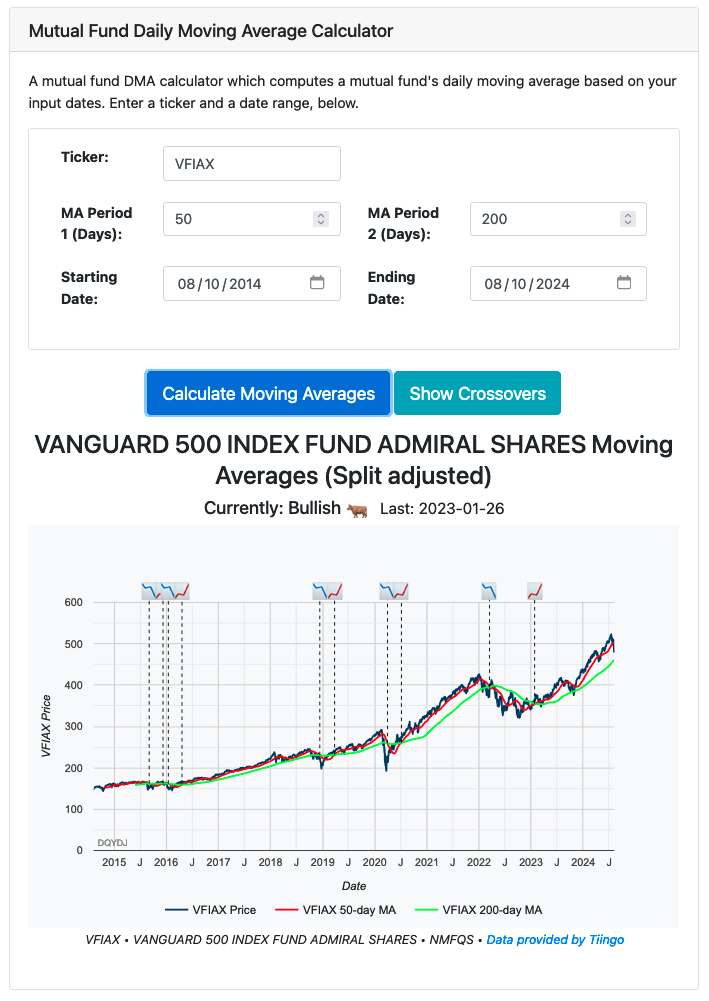
- Generate Moving Averages: Click this button to produce a chart displaying the fund's price alongside the two moving averages.
- Display Crossovers: Use this option to view a detailed table of crossover events. It shows whether each crossover was bullish or bearish, the duration of the preceding trend, and the moving average values at the crossover point.
Analyzing moving average crossovers can provide valuable insights into mutual fund performance trends. These crossovers often signal potential shifts between bullish and bearish market sentiments, offering clues about the fund's momentum.
Key Capabilities
Our Mutual Fund Daily Moving Average Calculator comes equipped with several powerful features:
- Custom Moving Average Computation: The tool calculates moving averages based on your specified periods, allowing for flexible analysis.
- Crossover Identification: The chart clearly marks bullish and bearish crossovers, helping you spot potential trend reversals.
- Dynamic Charting: Explore an interactive visualization of fund prices and moving averages. The chart's subtitle indicates the current trend, while crossover points are highlighted with 📈 for bullish and 📉 for bearish signals.
- Comprehensive Crossover Summary: Access a detailed table listing all crossovers, including dates, trend directions, adjusted values, and the duration of preceding trends.
The Significance of Moving Averages
Moving averages serve as a crucial tool in technical analysis, helping to smooth out price fluctuations and reveal underlying trends in mutual fund performance. By filtering out short-term volatility, moving averages offer a clearer picture of a fund's overall direction.
A popular analytical approach involves comparing two moving averages of different lengths, such as 50-day and 200-day periods. When the shorter-term average crosses above the longer-term one, it may indicate a bullish trend (often called a "golden cross"). Conversely, when the shorter-term average dips below the longer-term average, it could signal a bearish trend (known as a "death cross").
To deepen your understanding of moving averages and their role in financial analysis, we recommend exploring the Investopedia guide on Moving Averages.
Data Sources and Methodology
This calculator relies on historical price data for mutual funds provided by Tiingo.
Please note that the calculations do not factor in reinvested dividends. For a more comprehensive analysis that includes dividend reinvestment, we recommend using our mutual fund total return calculator. Additionally, you might find our tool for analyzing a mutual fund's historical drawdowns helpful in your research, along with a mutual fund correlation calculator.
Important Disclaimer
While we strive for accuracy and timeliness in our data and calculations, please understand that this tool is designed for informational purposes only. The results should not be construed as financial advice. Remember that past performance does not guarantee future results. We strongly encourage you to conduct thorough research and consult with a qualified financial advisor before making any investment decisions.
We hope this calculator proves valuable in your mutual fund investment analysis. For access to more financial tools and resources, please visit our Investing section.
