
On this page is our the Mutual Fund Drawdown Calculator. It helps investors understand the potential downside risks associated with a mutual fund investment by calculating the maximum drawdown and drawdown periods within a selected timeframe. Either graph the output or display a drawdown period table. Contains data for thousands of mutual funds, updated within the previous seven days.
Using the Mutual Fund Drawdown Calculator
To use this tool to analyze past drawdowns in a mutual fund investment, follow these steps:
- Ticker: Enter the ticker for a mutual fund. The list of tickers will auto-filter (and complete) while typing.
- Log scale: If checked, the tool will graph the mutual fund price history using a log scale.
- Starting Date: Enter the date you want to start analyzing drawdowns.
- Ending Date: Enter the date you want to end analyze drawdowns.
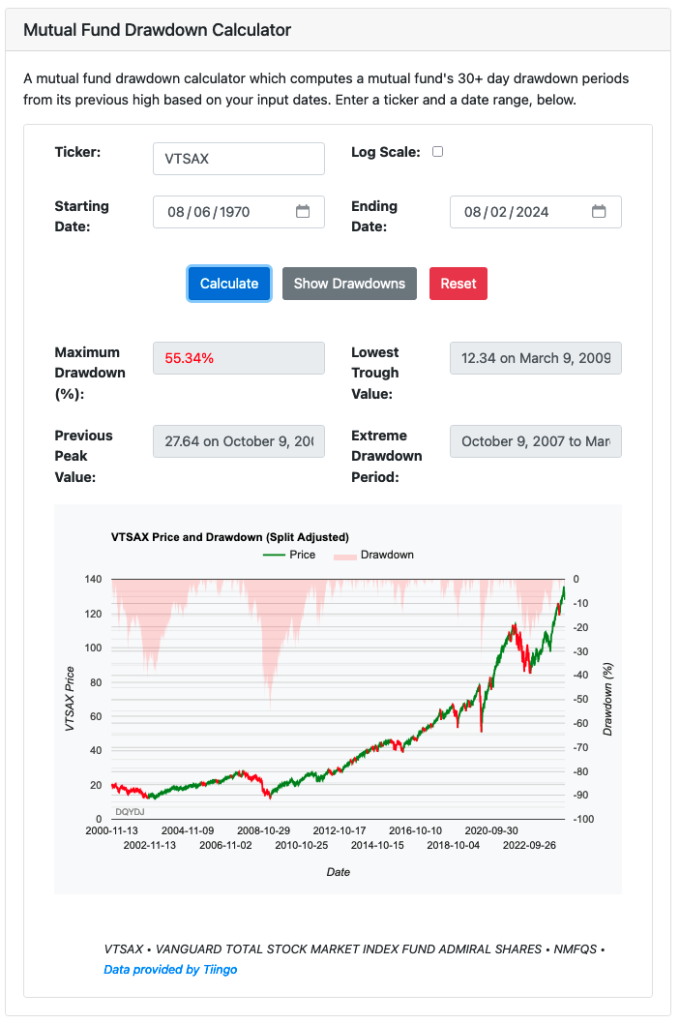
- Calculate: Click the Calculate button to view the maximum drawdown in that period along with a graph of your chosen dates dates. The tool will add a series with the mutual fund's price in that time, along with an overlaid area graph showing drawdowns from the previous closing peak.
- Show Drawdowns: Click the Show Drawdowns button to display a detailed table of all significant drawdown periods.
The table will include the mutual fund's peak and trough closing value and date, the percentage drawdown between the two, the duration of the drawdown period, and the volatility in that period. It only shows drawdowns of 30 or more days.
Understanding Drawdowns
Drawdowns in this tool measure the drop fromthe closing peak to bottom (alternatively, peak to trough) in the value of a portfolio, providing insights into the potential risk and volatility of mutual fund investments.
While historical performance is not a guarantee of future performance, it can be instructive. If a mutual fund has experienced significant declines in the past, this tool will show you visually how challenging those drawdown periods would have been.
Special Features
The Mutual Fund Drawdown Calculator offers several unique features:
- Maximum Drawdown: Calculates the largest percentage drop in investment value over the specified period. You'll see this if you hit the Calculate button (which also shows the graph).
- Drawdown Periods: Identifies specific periods where significant drawdowns occurred (defined as 30 or more calendar days from a peak) and puts stats on them in a table.
This is a feature of the Show Drawdowns button. - Volatility: Computes the annualized volatility during a drawdown based on daily log returns during the drawdown periods in the table.
- Interactive Graphs: Visualize drawdown dynamics with interactive charts that highlight drawdowns from the previous high at a date, along with the mutual fund's price through that period.
Methodology and Data Sources
The calculator uses historical price data for mutual funds from Tiingo.
Any forward or reverse splits are accounted for in the mutual fund price. Dividend reinvestment is not included (use the Mutual Fund Total Return tool for dividend reinvestment). Or, try the Mutual Fund Daily Moving Average Calculator to compare trend lines, or the mutual fund correlation calculator to see how funds differed return-wise.
Disclaimer
While we strive to provide accurate and up-to-date information, the results from this calculator are for informational purposes only and should not be considered financial advice. Past performance is not a guarantee of future returns. Always conduct your own research and consult with a financial advisor before making investment decisions.
We hope this tool aids you in learning more about how a mutual fund investment may have performed in the past. For more financial tools, check out our Investing category page.
