
Here we present a family household income percentile calculator for the United States in 2017. We estimate family income percentile down to the nearest 1% with your input to the tool.
Data comes from the March 2017 ASEC, and income is for full-year 2016. For all households, see our household income bracket article and household income calculator. For the full definition of family household, see below.
Also here on DQYDJ: individual income by age and a standard individual income calculator. For net worth, try the net worth percentile by age calculator and the standard net worth bracket calculator.
Source and Methodology on the 2017 Family Household Income Percentile Calculator
Sarah Flood, Miriam King, Steven Ruggles, and J. Robert Warren. Integrated Public Use Microdata Series, Current Population Survey: Version 4.0. [dataset]. Minneapolis: University of Minnesota, 2015. http://doi.org/10.18128/D030.V4.0.
Family Households are a special category of household, as defined by both the census (see here) and the popular consciousness. While Americans find many(!) ways to construct a household, the most common household type in America is still a 'family household'. Family households are 'maintained' or 'headed' by a householder who is part of a family, even if other non-family members reside as well. Even though boarders or live-in help might be present, the income in the tool is only income earned by the family.
Roughly 2/3 of American households are family households. In the 2017 ASEC, there are roughly 82,854,414 family households and 48,624 observations. Compare that to a total of 126,519,332 households in the full set (see the household income percentile calculator). When using the IPUMS-CPS data, you can use the FTYPE variable to directly grab family types... and from there, family households.
Also see the excellent resources on the Census's site related to family incomes.
A Better Measure of Household Income?
The United States has a lot of very... interesting... living arrangements. The majority of households, however, follow the classical pattern of a family household. It's no mistake that 65.4% of households are family households - it's an efficient way to align family members and raise children. For every hacker house in Silicon Valley, there are even more family households with families(and often, children) inside.
(I live here in the Bay... I had to lead with the meme hacker housing we're known for, ha).
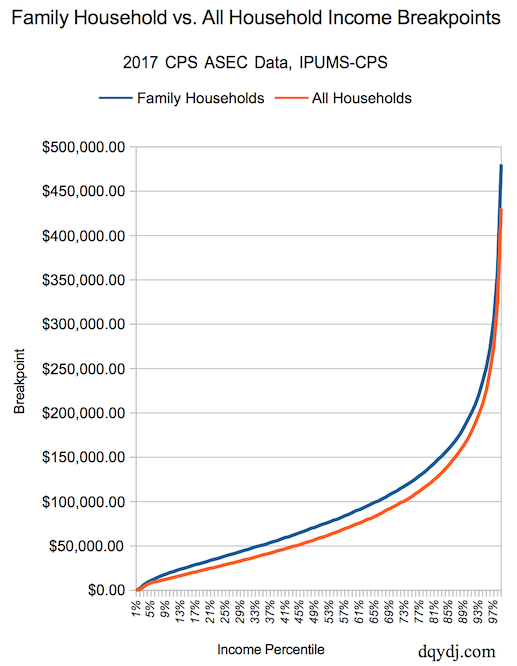
Family Household vs. All Household Income Distribution
A majority - even more than 65.4% - of you DQYDJ readers probably reside in the same type of household. While it's interesting to compare household incomes with the aforementioned hacker homes and other living arrangements, you'll have the best comparisons against similarly structured households.
Stay tuned! Next we're looking at at children in family households and comparing incomes with kids involved. Until next time, let me know the interesting living arrangements you've come across (outside hacker homes) in the comments.
