
Use our analemma calculator to visualize the sun's annual figure-8 pattern and calculate the equation of time for any day of the year. Generate sundial correction tables, explore seasonal variations, and see how the observation time affects the pattern's orientation.
Using the analemma calculator
Follow these steps to analyze solar position variations:
- Select Year: Choose from the current year ± 5 years to explore past or future patterns
- Adjust Time of Day: Slide from 6 AM to 6 PM to see how observation time affects the analemma's orientation
- Navigate by Day: Use the day slider or animation controls to trace the sun's annual journey
- Export Data: Download CSV summary data, CSV sundial corrections, or SVG graphics for the Analemma diagram or the Equation of Time diagram from the dropdown menu
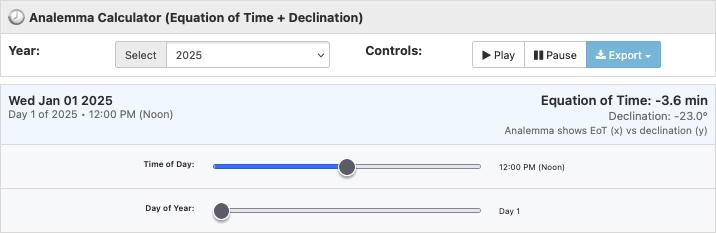
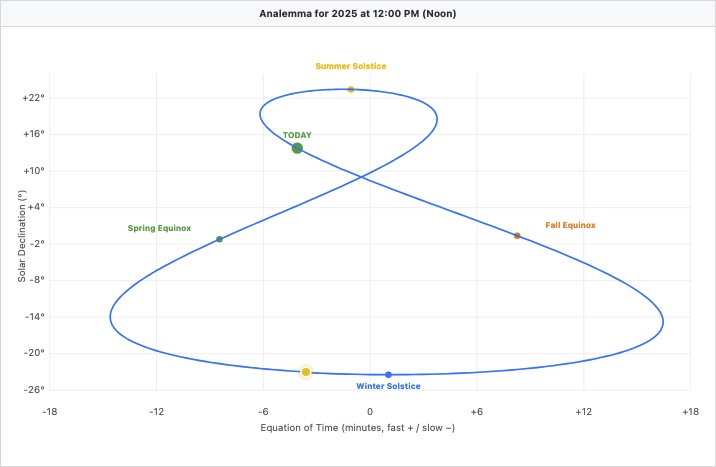
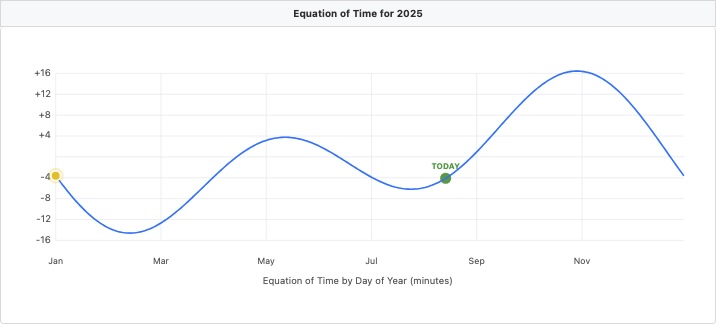
The calculator shows two synchronized visualizations: the classic analemma figure-8 (solar declination vs equation of time) and a separate equation of time graph throughout the year. The yellow sun marker tracks your selected position on both graphs by date.
Analemma tool features
The interactive display includes seasonal markers for equinoxes and solstices.
When viewing the current year, a green "TODAY" indicator shows your position in Earth's annual cycle. Hit the Play button to animate the entire year – watch how the sun speeds up near perihelion (early January) and slows down near aphelion (early July).
The Time of Day slider reveals how the analemma's orientation changes based on observation time. At noon, you see the classic vertical figure-8. Morning hours tilt it eastward, afternoon hours westward. This reflects the hour angle – your viewing perspective relative to the meridian.
Sundial corrections
Sundials display solar time, not clock time. The equation of time tells you how many minutes to add or subtract to get an accurate clock time from your sundial. In mid-November, sundials run 14.7 minutes fast. In mid-February, they're 14.6 minutes slow.
Export the Sundial Correction Table for monthly reference values. The CSV includes instructions: positive equation of time means the sundial is slow (add minutes), negative means it's fast (subtract minutes).
Data export options
Three export formats serve different needs:
- CSV Data: Daily equation of time and declination values for the entire year
- Sundial Correction Table: Monthly corrections with application instructions
- SVG Graphics: Export either visualization with embedded title and styling
Understanding the analemma
The analemma traces where the sun appears when photographed at the same clock time daily throughout a year, revealing how solar time differs from clock time – sometimes by over 16 minutes (in early November). Here are some other key terms.
Key definitions
Equation of Time: The difference between apparent solar time and mean solar time, ranging from roughly +16 to -14 minutes. This variation affects sundials, solar panels, and astronomical observations.
Solar Declination: The sun's angular distance north or south of the celestial equator, from +23.5° at summer solstice to -23.5° at winter solstice.
Solar Time: Time based on the sun's actual position. Solar noon occurs when the sun crosses your local meridian (its highest point for the day).
Hour Angle: The sun's angular distance from your local meridian, measured westward. Each hour represents 15° of Earth's rotation.
Perihelion: The point in a celestial body's orbit when it's closest to the sun. For Earth, perihelion occurs around January 3rd each year, when we're nearest the sun and moving fastest in our orbit.
Aphelion: The point in a celestial body's orbit when it's farthest from the sun. Earth reaches aphelion around July 4th each year, when we're most distant from the sun and moving slowest.
The analemma dilemma: Why the figure-8 pattern?
Two features of Earth's orbit create the analemma:
Elliptical orbit: Earth speeds up when closer to the sun (perihelion) and slows down when farther away (aphelion). This varying orbital velocity means solar days aren't exactly 24 hours – they're slightly longer or shorter depending on the time of year.
Axial tilt of 23.5°: Earth's tilt changes the sun's apparent speed across the sky. Near solstices, the sun's motion is predominantly east-west. Near equinoxes, it has a stronger north-south component.
Without the elliptical orbit, the analemma would be a straight north-south line. Without the axial tilt, it would be an east-west oval. Mash 'em up and you've got the elegant figure-8, with crossing points around April 15 and September 1.
Does the analemma change depending on where you are?
No, the analemma is identical everywhere on Earth. What changes with location is only the analemma's orientation in the sky and which portions appear above the horizon. At the poles, you'd only see half the pattern. At the equator, you'd see it standing vertically.
So on earth, whether you're in Boston, Beijing, or Buenos Aires, the figure-8 looks the same. (Though on Bennu it would look different!)
Methodology and technical notes
The calculator implements an approximation formula for the Equation of Time:
E = 9.87 \sin(2B) - 7.53 \cos(B) - 1.5 \sin(B)
Where:
- E: equation of time in minutes
- B: fractional year in radians, calculated as B = 2π(n-81)/364
- n: day of year (1-365/366)
Solar declination uses the approximation:
\delta = 23.45° \sin\left(\frac{360°(284+n)}{365}\right)Where δ is the solar declination in degrees. These formulas provide sub-minute accuracy for most applications. The time-of-day transformation applies rotation matrices based on hour angle, following methods described in sundial geometry references.
The first complete analemma photograph required 44 exposures on a single frame of film, created by Dennis di Cicco from 1978-1979. The mathematical principles trace back to Ptolemy's observations around 150 CE, though he lacked the photographic means to visualize the complete pattern.
Related sun and time calculators
Like the sun faithfully tracing its celestial figure-8, you've now traced through Earth's orbital dance on a site calling itself Don't Quit Your Day Job... what a fine loop it's been. Happy observing!
