
Track annual daylight patterns for any location worldwide with this interactive daylight hours graph calculator. Compare multiple cities, visualize seasonal variations, and see exactly how daylight changes throughout the year from winter solstice to summer solstice... and every equinox in between.
Using the Daylight Hours Graph
The daylight hours calculator works with any location worldwide. Search from 150,000+ cities, or enter precise latitude and longitude. Add up to four cities for direct comparison, then switch between graph, table, and stats views to analyze the data.
Basic features
- City Search: Find any location from our database of 150,000+ cities worldwide (we'll start autocompleting based on what you type), or enter precise latitude/longitude coordinates
- Multi-City Comparison: Add up to 4 locations to compare daylight patterns side-by-side
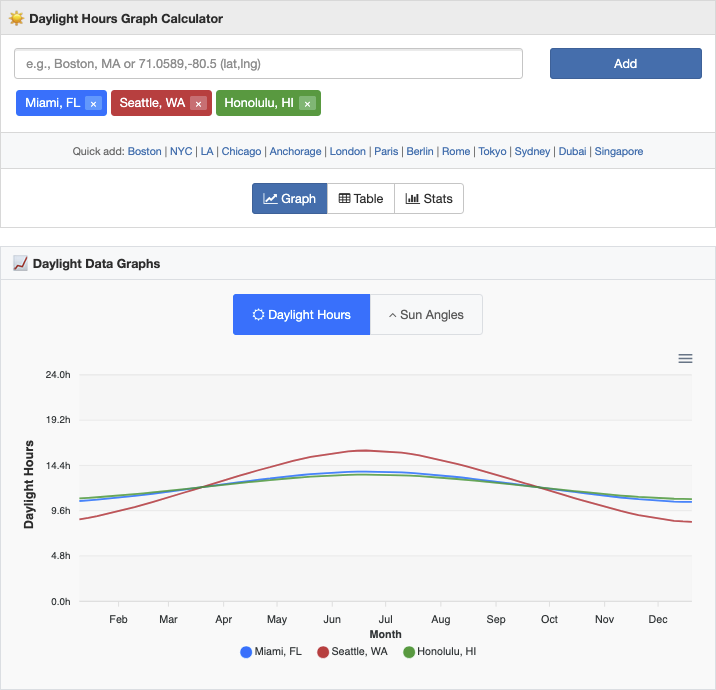
- Graph View: Interactive line charts showing annual daylight variation, with a toggle between daylight hours and sun angle data
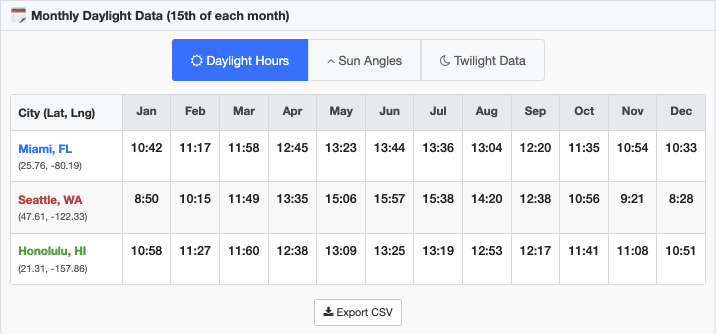
- Table View: Monthly daylight data in HH:MM format with options to view daylight hours, sun angles, and twilight times
- Quick Cities: One-click access to major world cities including Tokyo, London, Sydney, and more
Data views and analysis
- Daylight Hours Graph: Clean visualization showing how daylight duration varies throughout the year
- Sun Angles Graph: Maximum daily sun elevation angles, helpful for solar panel planning and architectural design
- Monthly Table: Precise daylight data (for the 15th of each month) to see rough stats for a month at a glance
- Twilight Data: Civil, nautical, and astronomical twilight times for photography and astronomy planning (see our day/night map as well)
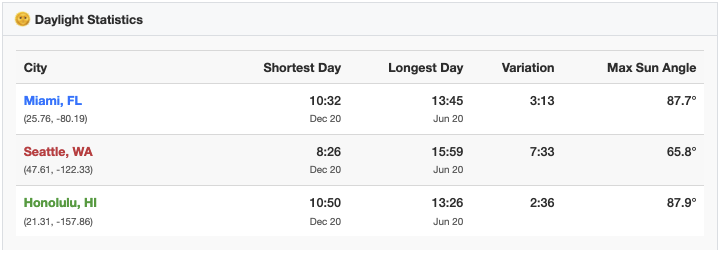
- Statistics View: Key metrics including shortest/longest days, solstice information, and seasonal variations
Export and sharing
- CSV Export: Download daylight data for spreadsheet analysis or external applications
- URL Sharing: Bookmark or share specific city combinations with automatically generated URLs
- Chart Downloads: Save graphs as PNG images or as CSVs for presentations or reports (via chart toolbar)
Example daylight comparisons
Want some examples? Try these pre-configured comparisons to explore global daylight patterns:
- Equator to Arctic: See how daylight variation increases with latitude
- Global Business Centers: NYC, London, Tokyo, Sydney timing
- Above Arctic Circle: 24-hour days and polar nights
- Nordic Capitals: Extreme summer/winter differences
- Southern Hemisphere: Opposite seasons from north
- Mediterranean Cities: Similar latitudes, subtle differences
- USA Coast to Coast: American daylight patterns
- Tropical Asia: Stable daylight year-round
- Desert Cities: Hot climates, varied daylight
- Canada East to West: Vast country daylight differences
- Latin America: Near-equator consistency
- East Asia Metros: China's vast latitude range
Understanding daylight patterns
Daylight hours vary dramatically based on latitude. Cities near the equator experience relatively consistent daylight year-round (~12 hours) with the sun reaching nearly overhead in most months, while locations closer to the poles see extreme seasonal variations: from nearly 24 hours of daylight in summer to just a few hours in winter (or, uhh, 0).
For polar regions above 66°N or below 66°S, you may see 24:00 (polar day) or 0:00 (polar night) during extreme seasons when the sun never sets or never rises. That's 24+ hour days and nights!
Seasonal variations by region
- Equatorial Regions: Singapore, Quito, and Nairobi see minimal variation (+/-1 hour throughout the year)
- Temperate Zones: Cities like New York, London, and Tokyo experience moderate changes (8-16 hours of daylight)
- High Latitudes: Northern cities like Anchorage, Reykjavik, and Tromsø show extreme seasonal swings
- Southern Hemisphere: Remember that seasons are reversed between hemispheres - December brings the longest days to Sydney and Cape Town
Data sources and accuracy
- Calculations use the SunCalc library for astronomical computations based on your exact coordinates.
- City data comes from the comprehensive cities.json database, covering over 150,000 locations worldwide.
Related sun and time tools
Explore our complete collection of solar and astronomical calculators for more specialized needs:
- Sunrise Sunset Calculator - Daily sun times with golden hour and blue hour for photographers
- Golden Hour Calculator - Perfect timing for golden hour photo sessions
- Blue Hour Calculator - Twilight window for dramatic photos
- Solar Panel Angle Calculator - Solar panel positioning for maximum energy capture
- Solar Tracker Map - Real-time sun and moon positions with interactive world map
- Sun Path Calculator - View daily sun trajectory
- Moon Phase Calculator - Track lunar cycles and moon illumination
- Day Night World Map - Visualize global day/night patterns and twilight zones
- World Clock - Live time zones and international time coordination
