
The Sun Path Diagram Generator creates polar sun path visualizations showing how the sun moves across the sky throughout the day, at a location you choose. Track solar altitude, azimuth angles, and seasonal variations for solar panel planning, architectural design, or understanding daylight patterns.
Understanding sun path diagrams
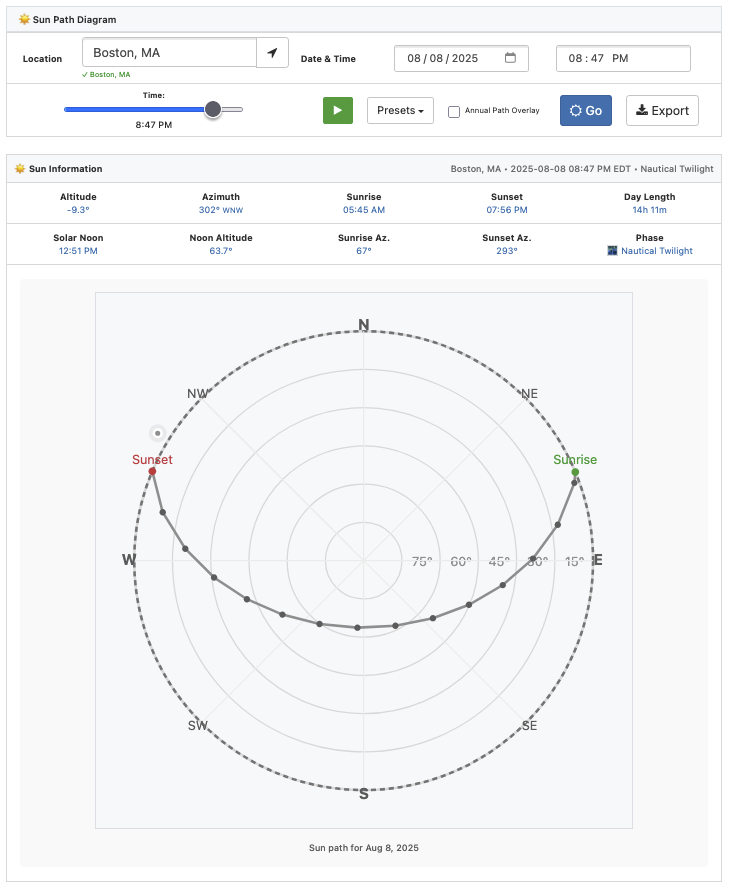
A sun path diagram (also called a solar path chart or sun chart) maps the sun's position in the sky throughout the day – or even across seasons. Our polar projection shows:
- Concentric circles: Altitude angles from horizon (0°) to zenith (90°)
- Radial lines: Compass directions (azimuth) with North at top
- Path curve: The sun's trajectory across the sky for your selected date
- Sunrise/sunset markers: Exact points where the sun crosses the horizon
- Current position: Real-time sun location (*if you picked today!*)
The diagram updates dynamically as you adjust the time slider, showing where the sun will be throughout the day. The night, too, technically – the projection tracks the tool before sunrise and after sunset, as well.
Sun path diagram inputs
By default, there are quite a few options that you can use to customize your run of the tool. Here's an overview of the most important parts:
- City search: Type a city name for autocomplete (or enter latitude and longitude)
- Saved locations: Your last location is remembered between visits
- GPS detection: Click the location arrow to fill in your current position
- Date picker: Any date past, present, or future
- Time slider: Quickly scroll through 24 hours to see the sun's movement. I have the sun change color based on the phase of day/night (and, of course, show it dim when it isn't visible!)
- Season presets: Quickly jump to solstices and equinoxes
- Animation mode: Press play to watch the sun traverse the sky much quicker than it actually traverses the sky
Changing the diagram with overlays
Toggle the Annual Path Overlay checkbox to see how sun paths vary throughout the year. This displays the sun's trajectory for all four seasonal extremes on one diagram:
- June solstice (highest path): Maximum daylight, steepest sun angle
- December solstice (lowest path): Minimum daylight, shallowest angle
- March/September equinoxes: Equal day and night, median path
Solar data provided
The tool calculates and displays quite a bit of solar information. I'll give an overview of the outputs, but you can also hover (tap on mobile) for tooltips.
Current sun position
- Altitude: Height above the horizon (0° to 90°, and negative for night)
- Azimuth: Compass bearing (0°/360° = North, 180° = South)
- Lighting phase: Day, twilight stages, sunrise, sunset, or night
Daily sun events
- Sunrise/sunset times: When the sun crosses the horizon
- Sunrise/sunset azimuths: Compass direction
- Solar noon: When the sun reaches its maximum altitude of the day
- Noon altitude: The highest sun angle for the day
- Day length: Total daylight hours and minutes
Export diagrams
After generating your diagram, click the Export button to download an SVG file. The exported diagram includes:
- Complete polar sun path visualization
- Location and date/time stamp
- All calculated solar data (altitude, azimuth, times)
SVG format ensures your diagrams remain sharp at any size, perfect for presentations, reports, or further analysis in vector graphics software.
Data sources and accuracy
- City data comes from the cities.json database, covering over 150,000 locations worldwide, and sourced from from GeoNames Gazetteer.
- Calculations use the SunCalc library for computations in your location.
Related sun and astronomy tools
Explore our complete suite of solar and astronomical calculators:
- Sunrise Sunset Calculator - Detailed twilight times and golden hour
- Solar Panel Angle Calculator - Optimize tilt for energy production
- Daylight Hours Graph - Visualize daylight changes across the year
- Golden Hour Calculator - Photography timing for perfect light
- Moon Phase Calculator - Lunar cycles and moonrise times
- Solar Tracker Map - Real-time global sun and moon positions
