
In 2023, the average American household held $89,643.42 in mortgage debt, home equity loans, and HELOCs with balances secured by their primary residence. 42.19% of households held this type of debt, so the median household held $0 – although the homeownership rate is well over 60%.
The average household also held $10,643.42 in debt secured by other residential property – think second and vacation homes. (Only 4.4% of households reported that type of debt).
Let's dive into residential home debt in this post and talk about the averages and summary statistics for a few types of breakdowns.
Mortgage and Home Debt Statistics in America
As I mentioned in the intro, most residential debt consists of mortgages, home equity loans, and HELOCs – home equity lines of credit.
And as I mentioned – homeownership is common. And so is home debt – 42.2% of households held at least some debt secured by a primary residence.
For the most timely statistics, the New York Federal Reserve reports quarterly on overall numbers.
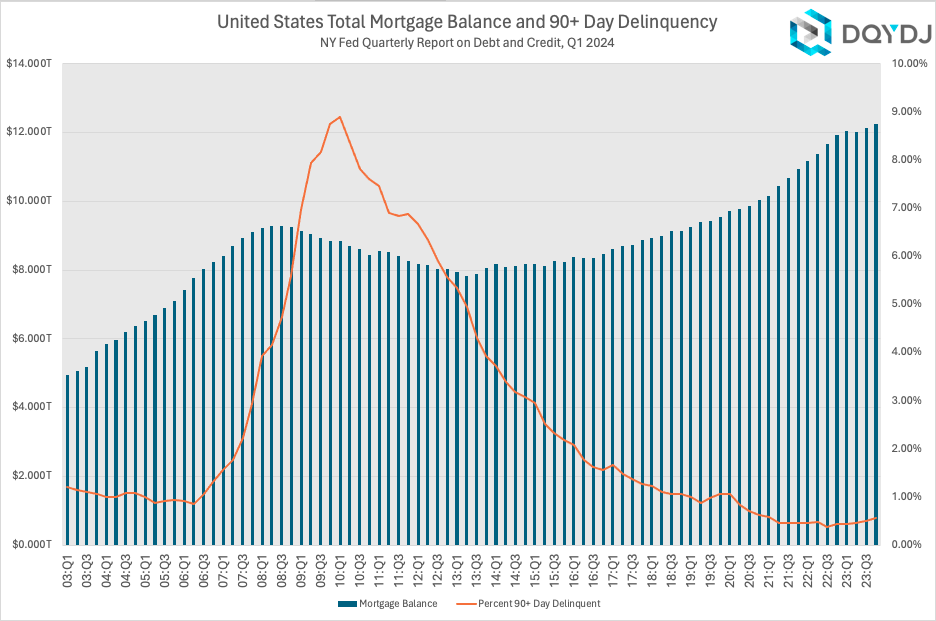
Through Q4 2023, the United States had $12.252 trillion in total mortgage balance. A mere .57% of that balance was considered seriously at risk – defined as 90+ days delinquent on payments.
Mortgage Debt Statistics by Percentile
Of course, some households hold much more mortgage debt than others. Like the rest of our debt statistics, mortgage debt (and other home debt) is heavily weighted to some households.
Here's how debt secured by a primary residence broke down in the 2022 SCF:
| Primary Home Debt Percentile | Primary Home Debt |
| 10% | 0 |
| 20% | 0 |
| 30% | 0 |
| 40% | 0 |
| 50% | 0 |
| 60% | $33,000 |
| 70% | $100,000 |
| 80% | $172,000 |
| 90% | $287,000 |
How popular are large mortgages?
Currently, the Federal Government allows you to write off mortgage interest secured by your primary home – up to a point [PDF]. Many states also have similar tax breaks and restrictions.
Here's how many households hold a primary home mortgage (or a Home Equity Loan, but not a HELOC) at some chosen breakpoints:
| Home Debt Amount | Households with Amount |
| $300,000 | 8.07% |
| $400,000 | 4.46% |
| $500,000 | 2.63% |
| $750,000 | 1.01% |
| $1,000,000 | 0.51% |
| $2,000,000 | 0.09% |
(There are roughly 131 million households in America).
Remember that these stats are a snapshot of debt at a point in time. Some households already paid off a higher balance. So people may have taken out larger mortgages which no longer have as large a balance.
But the truth is, large primary home mortgages with a balance that approach or exceed the cut-off threshold for a tax write-off are quite uncommon. (Second home mortgages are rare enough before trying to factor them into these statistics.)
Mortgage Debt by Generation
Another factor that affects homeownership – and debt – is age. In general, and as you can see in my net worth by age post, older folks generally have accumulated more money.
There are a few angles here. Younger folks own fewer homes, the houses they bought are more expensive (on average), they've had less time to pay them off, and (as stated above) they generally have less money saved.
These statistics include all debt secured by a primary residence. Here's what that looks like:
| Generation | Average | 25th Percentile | Median | 75th Percentile | Percentage with Debt |
| Millennial | $105,199.80 | $0.00 | $0.00 | $175,000 | 45.88% |
| Generation X | $134,419.00 | $0.00 | $41,000.00 | $195,000.00 | 54.94% |
| Baby Boomer | $65,144.07 | $0.00 | $0.00 | $82,000.00 | 37.97% |
| Silent | $29,887.97 | $0.00 | $0.00 | $0.00 | 23.47% |
And here's the age breakdown I used for generations (as of their survey in late 2022 or early 2023):
- Millennial (21-40 years old)
- Gen X (41-57)
- Baby Boomer (58-77)
- Silent (78-94)
Mortgage and Home Debt by Income Bracket
As with other types of debt, you find very interesting trends when you split up households by their income bracket. (See our household income research here). And yes, once again, this is for debt secured by a primary residence.
| Income Percentile (%) | 25% Debt | 50% Debt | 75% Debt | Average |
| 0-9.9 | $0.00 | $0.00 | $0.00 | $13,812.58 |
| 10-19.9 | $0.00 | $0.00 | $0.00 | $14,824.91 |
| 20-29.9 | $0.00 | $0.00 | $0.00 | $22,948.29 |
| 30-39.9 | $0.00 | $0.00 | $28,000.00 | $31,191.70 |
| 40-49.9 | $0.00 | $0.00 | $106,000.00 | $55,402.86 |
| 50-59.9 | $0.00 | $4,500.00 | $130,000.00 | $73,218.31 |
| 60-69.9 | $0.00 | $50,000.00 | $161,000.00 | $95,330.40 |
| 70-79.9 | $0.00 | $108,000.00 | $214,000.00 | $132,234.40 |
| 80-89.9 | $0.00 | $133,000.00 | $260,000.00 | $165,683.50 |
| 90-94.9 | $0.00 | $175,000.00 | $380,000.00 | $240,181.90 |
| 95-98.9 | $0.00 | $200,000.00 | $465,000.00 | $297,568.30 |
| 99-100 | $0.00 | $165,000.00 | $710,000.00 | $524,010.70 |
As you can see, more income means more mortgage. This trend overcomes the other trends above, such as age.
There are many factors here – indeed, mortgage interest is a good tax break, but houses are also more expensive where there are clusters of higher-paying jobs.
Home and Mortgage Debt in America Methodology
The Federal Reserve SCF's 2022 survey lends us the microdata to do all the demographic breakdowns. And a technical note – "households" are actually "Primary Economic Units" or PEUs:
"...the PEU consists of an economically dominant single individual or couple (married or living as partners) in a household and all other individuals in the household who are financially interdependent with that individual or couple.
Federal Reserve SCF Data Codebook, 2022
