
Presented here is a mutual fund correlation calculator which analyzes daily return correlations between actively managed and index mutual funds. The analysis can extend to thousands of mutual funds including domestic and international equity funds, bond funds, sector funds, and balanced funds.
Mutual fund correlation calculator for portfolio optimization
For a comprehensive universe of securities, explore our Security Correlation Calculator which combines stocks, ETFs, and mutual funds. Or, try our specialized Stock Correlation Calculator and ETF Correlation Calculator.
Analyzing mutual fund correlations
Start by selecting at least two mutual fund tickers and defining your analysis period. The calculator will compute correlations using daily return data to reveal past fund return relationship patterns... and any potential redundancies.
Mutual fund selection and configuration
The mutual fund correlation interface provides a few inputs for your analyzing pleasure:
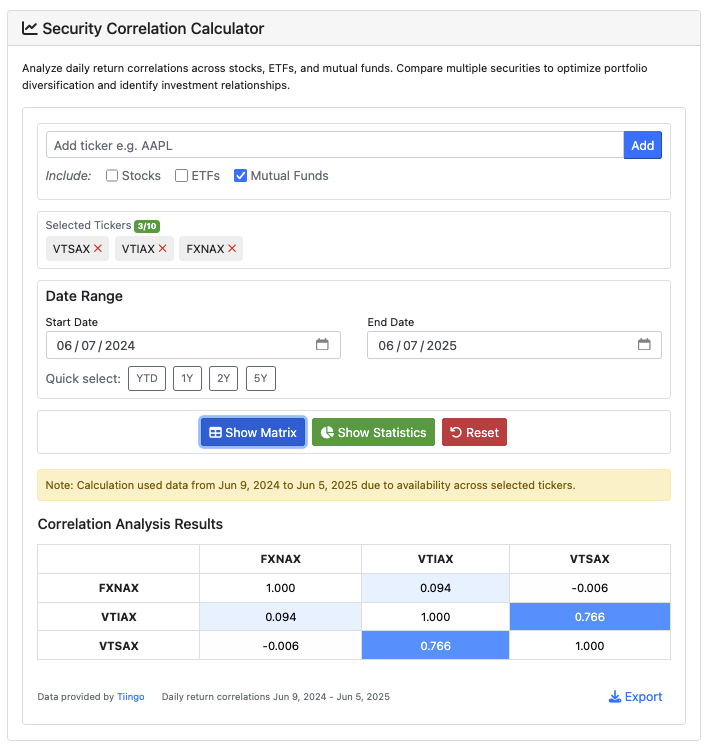
- Fund Symbols: Enter valid mutual fund tickers (e.g., FXNAX, VTSAX, VTIAX) for any mutual fund in the Tiingo data set. Also, try pasting multiple symbols separated by commas or new lines (up to 10)
- Time Period Selection: Choose from quick presets (YTD, 1Y, 2Y, 5Y) or define custom date ranges up to 10 years
- Portfolio Scope: Analyze up to 10 mutual funds simultaneously to understand correlation patterns across your complete fund-based investment strategy
Interpreting mutual fund correlation data
Results are presented through two perspectives: an interactive correlation matrix and comprehensive fund statistics.
- Fund Correlation Matrix: Presents pairwise daily return correlations between all selected mutual funds with visual indicators for overlap assessment
- Fund Overlap Analytics: Computes average correlation across funds, identifies most and least correlated fund combinations, and measures correlation ranges
- Management Style Analysis: Determines which fund pairs maintain consistent correlations (suggesting similar strategies... or circumstances) versus those with variable relationships
- Dynamic Visualization: After running, hover over correlation values for rolling correlation trends and detailed relationship explanations
Mutual fund correlation value meanings
Mutual fund return correlations indicate how fund returns moved relative to each other throughout your analysis timeframe:
- +0.8 to +1.0: Very high correlation - funds likely have similar holdings or track comparable benchmarks
- +0.6 to +0.8: High correlation - funds probably share significant investment themes or market exposures
- +0.3 to +0.6: Moderate correlation - some overlap but perhaps some meaningful diversification benefits remain
- -0.3 to +0.3: Low correlation - funds have historically provided substantial diversification
- Below -0.3: Negative correlation - funds tend toward opposite performance (excellent for risk reduction)
Active management and correlation analysis
Many actively managed funds show high correlations with their benchmarks or similar funds, suggesting limited differentiation despite higher fees – there's even a nickname for this phenomenon: shadow indexing. Conversely, funds with consistently low correlations may indicate genuine active management or unique investment approaches.
You can use correlation analysis as one input to assess whether your fund selections justify their costs. If multiple funds in your portfolio show correlations above 0.8, consider whether you're paying multiple management fees for the same market exposure.
Downloading mutual fund correlation results
Save your mutual fund correlation analysis by selecting the Export button. The generated CSV contains the complete correlation matrix, statistical summary, and analysis metadata.
Mutual fund data sources and analysis methods
The fund correlation calculations use Tiingo API data with these restrictions:
- Mutual fund pricing data updated within 7 days of fund NAV publication
- Usage parameters for optimal system performance:
- 50 correlation calculations per day
- 10 calculations per minute
- Maximum 10 mutual funds at a time
- Analysis periods capped at 10 years
Mutual fund correlation calculation approach
Here's how the mutual fund correlation calculator works:
- Determines daily percentage returns using net asset value data for each mutual fund
- Aligns data to common valuation dates across all selected funds
- Applies Pearson correlation methodology to calculate correlation coefficients between fund return series
- Generates stability metrics using rolling correlation windows to evaluate relationship consistency over time
Mutual fund analysis disclaimers and limitations
Mutual fund correlations are based on historical performance data and past relationships do not predict future fund correlations.
This calculator provides research and educational information only and should not be considered financial advice. Always verify results independently... and consult qualified professionals for investment decisions, don't ask me.
Mutual fund correlations can change due to manager turnover, strategy shifts, or changes in underlying market conditions. The analysis does not consider fund-specific events that may impact relative performance between funds – though it does use daily value, so it should account for fees (but not backend or frontend loads).
Support and improvement requests
Contact us if you identify calculation errors or data inconsistencies. Please include the specific mutual fund symbols and date range that produced unexpected results.
I welcome suggestions for enhancing the mutual fund correlation calculator – but remember, this is a free, advertising-supported tool. Major enhancements require consulting arrangements. Your input helps improve the tool for the investment community, though, so if you have a broadly applicable suggestion I'll likely add it.
And remember, I'm not an investment advisor, and I'm certainly not your investment advisor. I cannot provide mutual fund recommendations, asset allocation guidance, or fund selection advice. This tool serves educational and research purposes. Verify the results elsewhere!
Complementary correlation analysis tools
Expand your investment analysis capabilities with our related tools:
- Security Correlation Calculator - Multi-asset analysis including stocks, ETFs, and mutual funds
- Stock Correlation Calculator - Individual equity correlation analysis
- ETF Correlation Calculator - Exchange-traded fund correlation assessment
- Cryptocurrency Correlation Calculator - See how cryptocurrencies move together
Mutual fund correlation analysis in portfolio management
This mutual fund correlation calculator can help evaluate whether your fund selections provide genuine diversification... or expensive duplication.
A portfolio of funds with correlations consistently above 0.8 may be a sign you're paying multiple management fees for the same market exposure. And on the other hand, identifying truly uncorrelated funds might help build portfolios that perform more consistently across varying market conditions.
We'll see, anyway. Have fun with the tool!
Further your mutual fund analysis with these resources:
- Mutual Fund Return Calculator - Analyze fund performance including reinvestment scenarios
- Mutual Fund Drawdown Calculator - Evaluate past maximum loss and volatility metrics
- Mutual Fund Daily Moving Average Calculator - See fund DMAs and trends
- Investment Calculator - Model future scenarios and portfolio projections
