
Introducing the Avalanche Drawdown Calculator - your go-to tool for unmasking potential risks within your Avalanche (AVAX) investment. This calculator lets you analyze historical drawdowns, volatility, and peak-to-trough declines, providing valuable insights to fortify your investment strategy against unexpected frights.
Using the Avalanche Drawdown Calculator
Ready to unveil the past secrets of an Avalanche investment? Here's how to operate this tool:
- Starting Date: Select the date you first invested in AVAX, or any other significant point to commence your analysis.
- Ending Date: Choose the date to wrap up your drawdown investigation. (Unfortunately, this tool can't predict the future, so no forward dates allowed!)
- Calculate: One click, and the calculator will fill your screen with maximum drawdowns, drawdown periods, and a chart of Avalanche's price trajectory with drawdown overlays.
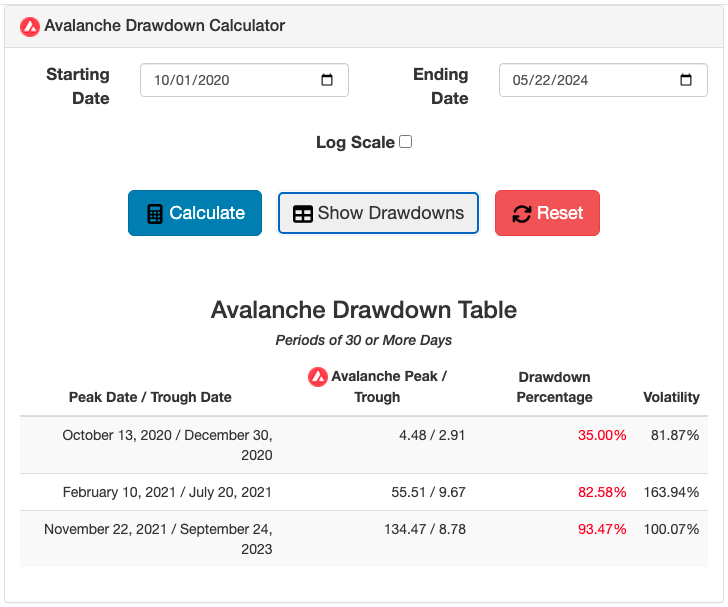
- Show Drawdowns: Summon a detailed table of all significant drawdown periods with peak/trough values, declines, and volatility metrics. Only periods spanning 30+ days are displayed.
Understanding drawdowns is important for any crypto investor seeking to suss out potential risks and see past volatility. These metrics measure the decline from peak to trough, providing insights into your investment's potential downside exposure by showing you the past.
Key Features
This Avalanche calculator is packed with these extra features:
- Maximum Drawdown: Identify the largest percentage drop your AVAX investment has taken - a metric to assess potential downside risks.
- Drawdown Periods: Gain insights into specific time frames when drawdowns haunted an Avalanche portfolio, letting you assess their duration and intensity.
- Volatility: Each drawdown period is accompanied by an annualized volatility calculation.
- Interactive Graphs: An interactive price chart has an overlaid drawdown visualization, showing price and drawdown from past peaks on the same graph.
Data & Methodology
This calculator makes its calculations from historical Avalanche price data provided by CoinGecko.
For more Avalanche-focused tools, explore our AVAX Investment Calculator, AVAX Daily Moving Average tool, Avalanche to USD Converter, and USD to Avalanche Converter.
Disclaimer
While we strive to provide accurate and up-to-date information, the results from this calculator should be treated as estimates only - not financial advice. Past performance is no guarantee of future returns, so always do your own research and consult professionals before making any investment decisions.
We hope this Avalanche Drawdown Calculator empowers you to make well-informed, courageous decisions regarding your investments in AVAX. For more financial tools and resources, explore our Investing category page.
