

This article looks at wealth drawdowns for American retirees. We examine net worth data for heads of households with age ranges 65-69, 70-74, 75-79, 80-84, and 85+.
Seeing the average net worths of different retiree age groups gives you an idea for fund drawdown. Ideally, it also suggests a path for your own wealth drawdowns.
After Retirement, How Do Americans Draw Down Wealth?
This is a very interesting phenomenon to think about: at a certain point, perspective when it comes to wealth should switch from accumulation to planning on drawing down.
Whether that means spending, or perhaps succession planning, or charitable and political causes, we don't know. However, we can tell you the change in net worth for older households.
Let's look:
We took retirees (or potential retirees) to be part of households where the head is 65 years old or older.
Methodology for Retiree Wealth Drawdowns
If you've been following us for a while, you'll be familiar with our methodology on handling SCF data - it is detailed in our first article in the series on how wealth doesn't track income as well as we think it does.
The number of samples, especially for older retirees, is low enough to be concerning. We only broke down the quantiles with what would roughly follow the central limit theorem, assuming we'd need around 25 samples for each. In reality, it means the 85+ and the 80-84 brackets are "pushing it".
Here is the raw data so you can be fully informed:
| Age | 65-69 | 70-74 | 75-79 | 80-84 | 85+ |
| 5.00% | $1,220.00 | $110.00 | -$40.00 | $2,000.00 | $0.00 |
| 10.00% | $16,200.00 | $4,700.00 | $2,151.00 | $8,680.00 | $2,220.00 |
| 15.00% | $41,400.00 | $12,100.00 | $9,240.00 | $23,240.00 | $8,320.00 |
| 20.00% | $64,300.00 | $28,230.00 | $34,100.00 | $55,800.00 | $21,750.00 |
| 25.00% | $86,200.00 | $39,510.00 | $59,600.00 | $68,000.00 | $54,000.00 |
| 30.00% | $109,500.00 | $72,980.00 | $86,600.00 | $101,710.00 | $75,800.00 |
| 35.00% | $127,800.00 | $107,610.00 | $114,400.00 | $117,500.00 | $85,200.00 |
| 40.00% | $154,600.00 | $148,620.00 | $147,900.00 | $158,500.00 | $103,820.00 |
| 45.00% | $199,600.00 | $187,300.00 | $185,330.00 | $191,200.00 | $127,000.00 |
| 50.00% | $263,200.00 | $211,850.00 | $207,960.00 | $216,180.00 | $149,700.00 |
| 55.00% | $319,800.00 | $253,800.00 | $241,600.00 | $236,100.00 | $183,610.00 |
| 60.00% | $364,560.00 | $292,300.00 | $293,300.00 | $252,000.00 | $207,090.00 |
| 65.00% | $411,500.00 | $394,100.00 | $317,300.00 | $280,300.00 | $229,600.00 |
| 70.00% | $540,100.00 | $476,399.00 | $366,300.00 | $310,050.00 | $256,400.00 |
| 75.00% | $713,600.00 | $666,000.00 | $432,200.00 | $448,870.00 | $303,300.00 |
| 80.00% | $940,000.00 | $880,900.00 | $568,600.00 | $550,050.00 | $420,000.00 |
| 85.00% | $1,318,700.00 | $1,222,900.00 | $621,100.00 | $644,201.00 | $707,000.00 |
| 90.00% | $2,134,000.00 | $1,875,000.00 | $954,200.00 | $984,700.00 | $832,600.00 |
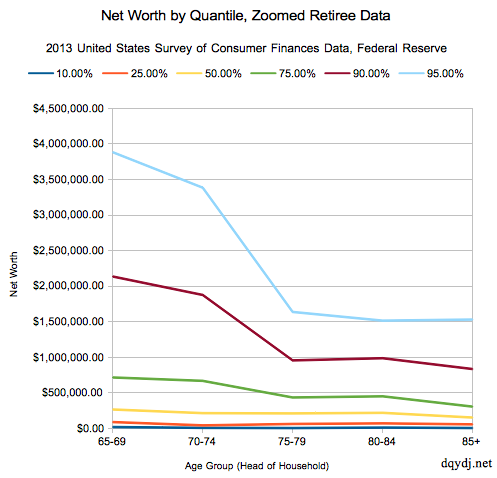
| 95.00% | $3,883,000.00 | $3,384,000.00 | $1,635,900.00 | $1,513,699.00 | $1,529,000.00 |
| (Samples) | 2310 | 1775 | 1150 | 760 | 720 |
We hope that you'll agree that even if the numbers aren't exact, there is enough data here to visualize drawdowns. And, really, the numbers should be decently accurate near the medians - good enough for our purposes, certainly.
This data was computed using 2013 Federal Reserve SCF data from the Federal Reserve.
Conclusion
There is definitely very clear evidence of drawdowns across a significant number of net worth brackets. It appears drawing down begins in earnest around age 70-74.
