
Today we’re elated to host this epic guest post from Fat Tailed and Happy, who writes at his eponymous blog. Enjoy!
Robert Shiller received a Nobel Prize for linking long term stock returns and valuation. His work has since been proved in numerous economies over the past two centuries.
Yet, Shiller’s preferred valuation metric, the cyclically adjusted price to earnings ratio (CAPE), explains only about 40% of the deviation in long term returns. This loose correlation frequently leads to critiques from the random-walk community who contend CAPE is of no use in investing around the business cycle.
I’m honored for this opportunity to expand on Shiller’s work.
Using data from 1920-Present, equity returns show a clear dependence on CAPE, interest rates, and time itself. Unfortunately, data suggests the trends which made recent strong equity performance possible are reversing. It is therefore possible that future returns may be poor.
CAPE And Forward Returns
CAPE smooths valuations by using the average earnings of the preceding 10 years in its calculation of valuation. Earnings typically increase during expansions and decrease during recessions; the attraction of CAPE is it accounts for both of these periods with the longer time lag.
Higher values of CAPE mean stocks cost more for a dollar of earnings than in the past, reflecting an overvalued sentiment. Shiller’s critical finding was that ten-year returns are negatively related to CAPE. The loftier the starting value, the poorer the subsequent return:
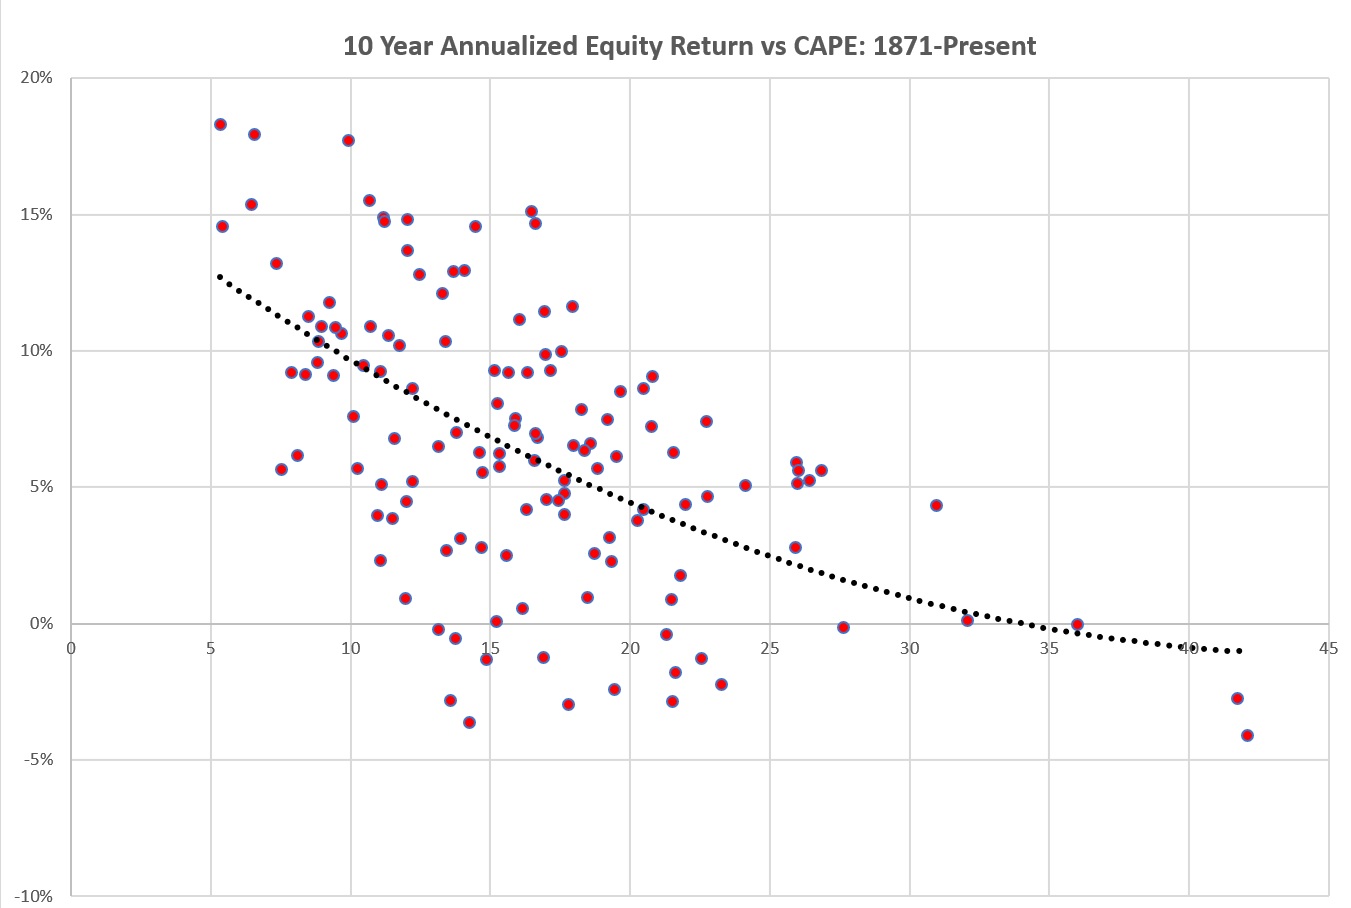
Despite its power, CAPE is a poor indicator for shorter term allocation and only explains about 40% of stock returns. It is the latter point we seek to improve.
The Importance of Time
Markets of 150 years ago certainly had nowhere near the oversight and regulation of the modern day, nor were the accounting standards or breadth of market exposure comparable. Additionally, tax rates, trade regimes, and a multitude of other factors undoubtedly influence equity valuation – and dramatically.
A fully specified treatment of each of these factors is beyond the scope of this post. However, this DOES suggest equity returns may structurally differ across time.
Therefore, equity return estimates may be improved by including two additional variables to CAPE:
- Interest rates on bonds provide clear signals of the appropriate value of time and govern the discount for future earnings.
- Time itself serves as a proxy for legislative complexity.
Modeling
Robert Shiller provides all of his data to the public, and it must hold the record for the most traffic to something that looks like an old Geocities site from 1994.
Three econometric models of his data follow using data from 1920-Present. In all cases, the annualized real forward ten-year return of stocks is the variable in question. As an example, for the year 2000:
- We analyze annualized returns from 2000 to 2010, net of inflation
- Variables used to explain future returns are interest rates, CAPE, and time effects as of 2000
Three specifications follow:
- “CAPE ONLY” – Predicts stock returns on the basis of ONLY CAPE
- “CAPE, Interest, Time” – Uses CAPE combined with nominal interest rates. Time trends pick up a constant increase in equity returns.
- “CAPE, Interest, Decades” – Uses a separate adjustment for each decade, normalized to the 1920s. This permits each decade to have a structurally different tax or trade structure.
Model Results & Catharsis
MARKET RETURNS VS CAPE : 1920 – PRESENT
| CAPE ONLY | CAPE, Interest, Time | CAPE, Interest, Decades | |
| R-Squared | 0.400 | 0.524 | 0.819 |
| Constant | 0.147 | 0.110 | 0.184 |
| CAPE | (0.005) | (0.007) | (0.007) |
| Interest Rate | - | (0.006) | (0.005) |
| Time Trend | - | 0.001 | - |
| 1930s | - | - | (0.035) |
| 1940s | - | - | 0.024 |
| 1950s | - | - | 0.039 |
| 1960s** | - | - | (0.017) |
| 1970s** | - | - | (0.019) |
| 1980s | - | - | 0.065 |
| 1990s | - | - | 0.081 |
| 2000s | - | - | 0.062 |
** Variables Not Significant At 95% Level
CAPE
Increasing CAPE by 10 lowers future real returns by 7% per year over the subsequent decade. CAPE explains about 40% of the variation in equity returns and cannot be ignored.
Interest Rate
A 1% increase in the 10-year yield trims half a percent annually to stock returns. This matches intuition: lower interest rates allow corporations more leverage and cheaper financing, boosting future earnings.
Impact Of Time
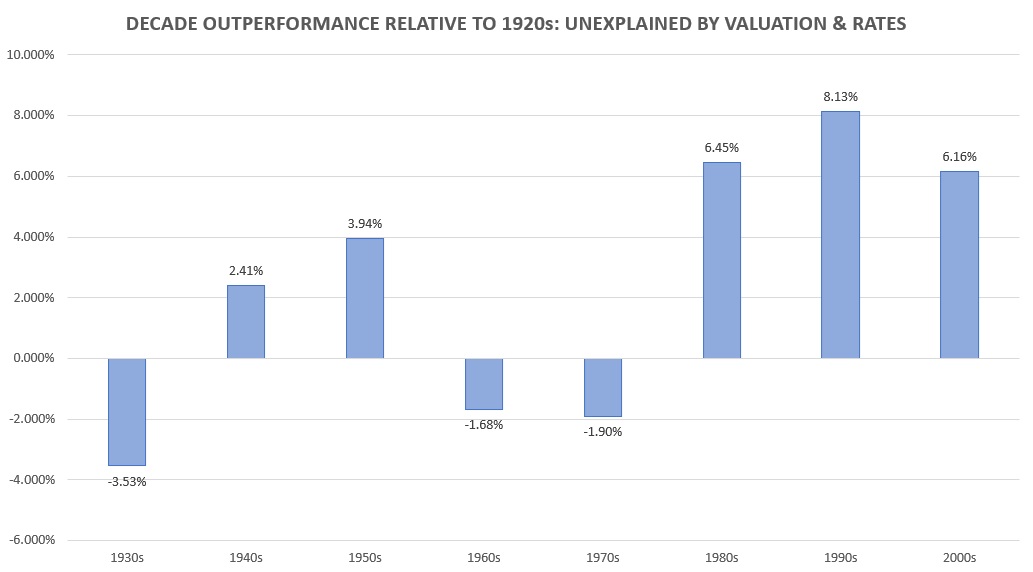
Both time models find a positive relationship between time and equities. Upon closer analysis, real returns found a tailwind in the 1980s which resulted in 6% to 8% MORE annual real returns even after adjusting for CAPE and interest rates. Time evolution and CAPE each explain 40% of future returns.
We conclude CAPE, interest rates, and market structure are critical to future returns.
Why Are Returns Getting Bigger Over Time?
The increase in equity returns over time, beyond other factors, is curious. What explains this?
Certainly, tax trends over the period have been biased towards more favorable corporate tax policy.
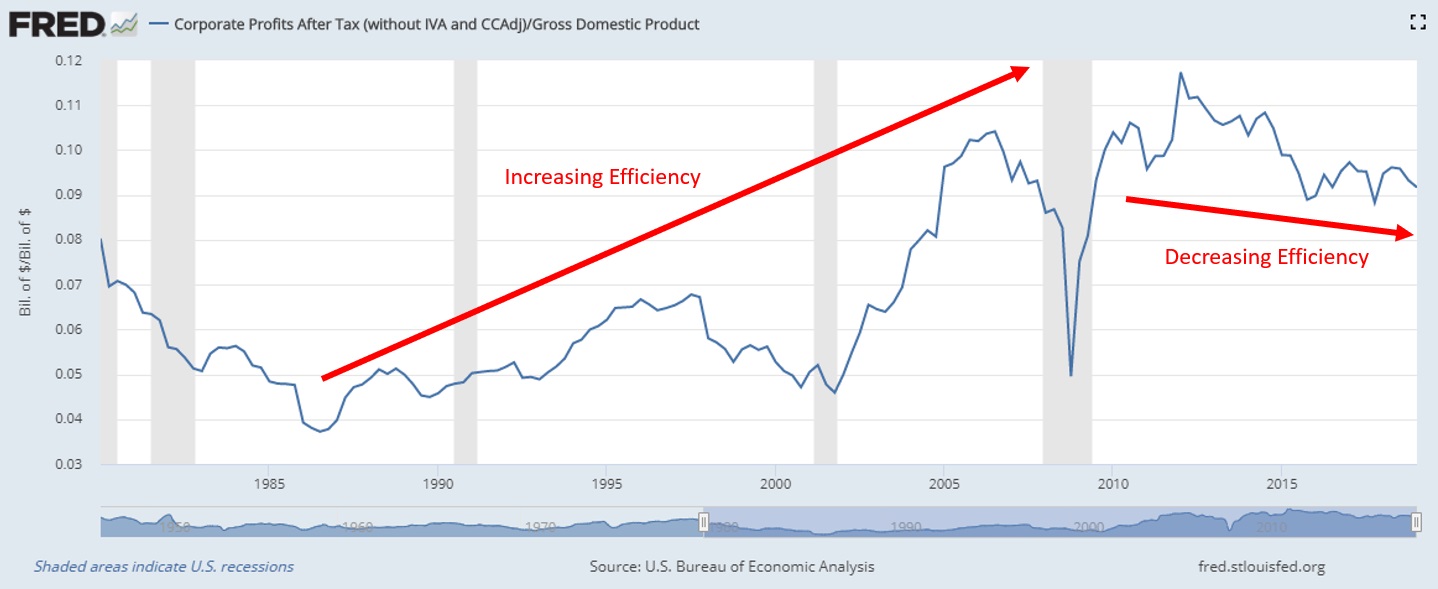
Additionally, the fundamental engine of corporate profits is productivity. Automation, moving supply chains to low cost areas, and improved decision making with technology shows up as lower costs and a healthier bottom line.
The rapid globalization in the aftermath of the Cold War meant US companies could source materials efficiently and cheaply from overseas suppliers while technology meant workers became ever more productive in their roles. Profits and stock prices exploded.
Federal Reserve data to 1980 confirms this. Corporate profits as a share of GDP increased dramatically up until nearly 2010, and then decayed.
The same phenomenon persists in worker productivity numbers; worker output grew strongly until the Great Financial Crisis; it has since struggled to improve:
AVERAGE PRODUCTIVITY GROWTH
| 1980s | 1.6 |
| 1990s | 2.2 |
| 2000s | 2.8 |
| 2010s | 0.9 |
Source: Nonfarm Business Sector Real Output per Hour Percentage Change
Uncharted Territory
I believe the trends which explain why stocks outperformed so strongly in 1980-2010 are now reversing, and we see it in the faltering productivity data above.
Demographics: The 1980s to 2010s coincided with favorable demographics as baby boomers hit their productive stride. Nearly 50% of GDP growth originates from raw population growth, and we now see an aging American workforce with low birthrates and an increasing hostility towards immigration. We’ve already witnessed what this did to GDP in Japan and now Europe. It isn’t good.
Trade: A significant portion of the country supports protectionism and believes that tariffs to protect American jobs are sound policy. I will not go into the politics of that discussion (though I have looked at Milton Friedman quotations on the topic), but increasing costs in production counter the trends from the preceding 30 years. It is not bullish for stocks.
Economic Growth: In the opposite of recession, there are two clear trends in US expansions: 1) they are longer, but more sluggish and 2) equity returns correlate to the strength of expansions. A low growth world struggles to sustain higher equity returns.
Interest Rates: At the zero bound, the impact of interest rates may reverse. While lower rates are good for earnings, they also influence the discount on future earnings and the equity risk premium. What happens with real rates of zero (or lower) in perpetuity? Could future returns already be priced in?
CAPE: In the 150+ years of Shiller data, it is literally unprecedented to see CAPE in the 30s with real rates this low. We are in uncharted territory.
On the basis of these fundamental factors, it seems as though the strong outperformance will be difficult to replicate in the coming decade.
Expected Returns
As a result, the prognosis for the future isn’t great. In the following chart, black indicates actual returns with corresponding model fits plotted in color. All are based on CAPE.
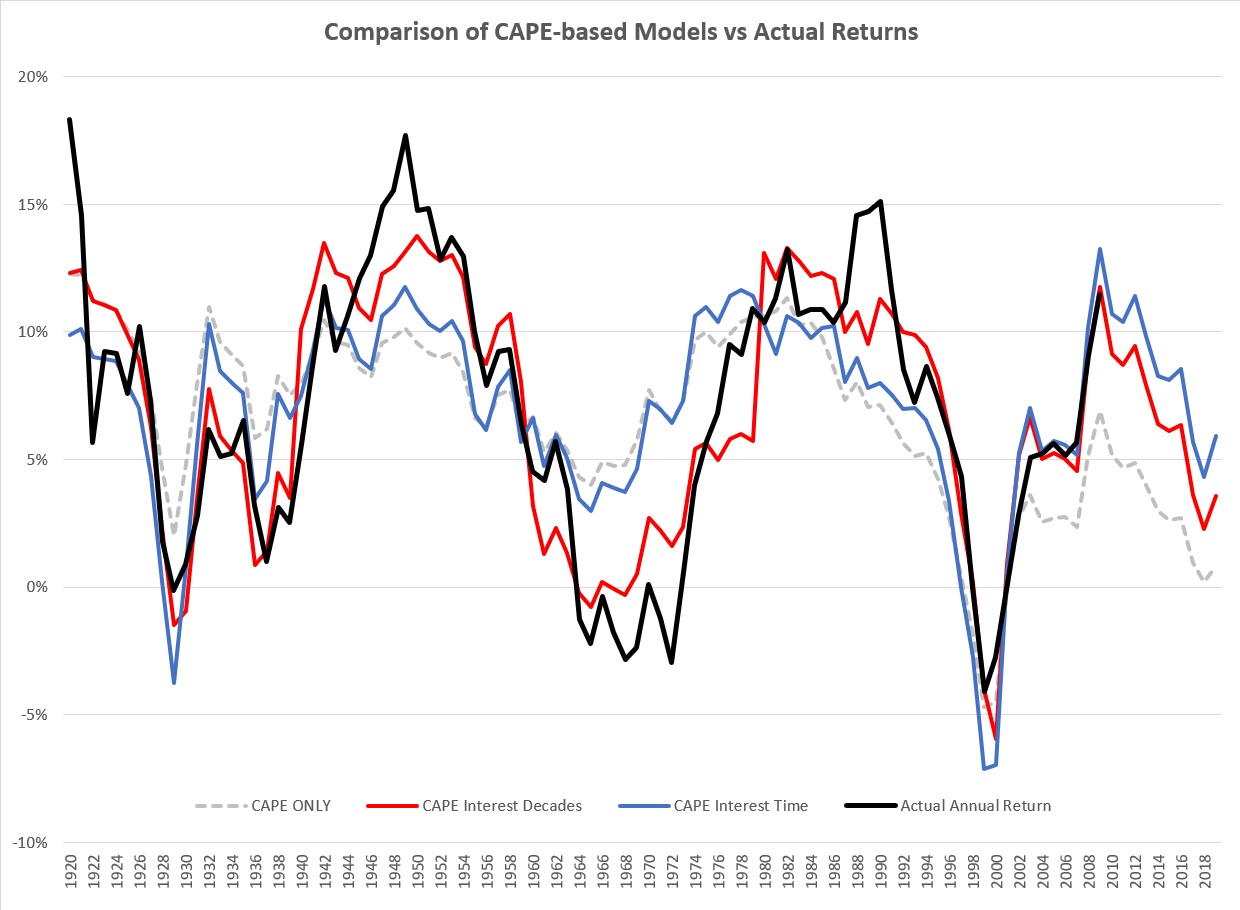
The time-based models fit the best; return projections suggest a range from very tepid to downright atrocious.
DISCLAIMER: NONE OF THIS IS ACTIONABLE FINANCIAL ADVICE AND IS FOR INFORMATIONAL PURPOSES ONLY.
FORECASTED 10Y RETURNS
| CAPE ONLY | CAPE. Interest, Time | CAPE, Interest, Decades | |
| 2019-2029 | 0.008% | -0.025% to 3.5% | 5.900% |
The middle result requires some clarification.
Assuming we achieve the ~6% outperformance achieved since the 1980s, the forecast is 3.5%. Were the fundamental factors identified above to hamper this growth (as I believe they might), real returns might be as low as -0.025%.
This DOES suggest a more bullish potential world than CAPE alone allows (0%). But returns are still far below average.
Tying It All Together
The above is a lot to digest.
The key points are:
- Stock returns undoubtedly depend on CAPE and interest rates. We know what these are.
- They also depend on time-dependent subtleties of each decade. We know what these were.
- Evidence suggests it will be hard for the economy to replicate the past because structural currents flow against it.
The totality suggests a difficult environment moving forward for stocks over the next decade, albeit returns will likely be stronger than predicted by CAPE alone. Strong performance will require some mechanism to dramatically lower corporate costs, either by lower labor, freer markets, or technological revolution…… or…. a material correction in prices.
Fat Tailed And Happy holds a PhD in economics and writes about CAPE, recessions (including recession proof businesses), economics, and safe withdrawal rates in a low return world. The preceding analysis is for informational purposes and is not financial advice.
Comments or suggestions greatly welcomed here or on Twitter @FatTailedHappy
