
During their July meeting, the Federal Open Market Committee chose to lower the target Federal Funds Rate to 2% - 2.25% from 2.25% - 2.5%.
While the financial press implied this was bullish for stocks, the S&P 500 immediately fell on the news (and Fed commentary). Further, the yield curve remains inverted – or has even become more inverted – in the wake of the news.
With all of the bullish commentary around rate cuts... including from the President himself... you'd be forgiven for thinking rate cuts are bullish. So, how does an interest rate cut affect the stock market?
What is the Federal Funds Rate?
Quite simply, the Federal Funds Rate is the interest rate at which depository institutions (mostly credit unions and banks) lend their reserve funds to other depository institutions.
Importantly, it's a short term rate – overnight and uncollateralized. That is, it's what banks charge other banks to borrow on an immediate basis.
How Does the Federal Reserve Affect the Federal Funds Rate?
Depository institutions are required to hold reserve funds according to the amount of deposits they house from their customers. These reserve funds are the minimum they must keep on hold with the Fed in the form of cash at the bank or (alternatively) deposits at one of the Federal reserve banks.
While the Fed can implement monetary policy by changing reserve requirements , they tend to influence monetary policy through open market operations. With open market operations, the Federal Reserve buys government issued bonds and securities to move these average rates.
An interesting side-note: since the great Recession of 2008-2009, the Federal reserve has moved beyond Government Issued bonds and securities with its market operations. Since the crisis, the Fed has bought longer dated treasuries and even mortgage backed securities to further its cause.
Federal Funds Rate History
To study the effect of rate cuts on market, we first need to see when rate cuts happened historically.
The Federal Reserve has been around since 1913. It has changed quite a bit since those days, especially around transparency.
To wit: the Federal Reserve at one point didn't communicate its thoughts or even its target rate. At one point market participants had to infer policy from the Fed's behavior in the open market.
Still, since roughly 1950 we have decent data on the effective Federal Funds Rate. Let's use art – and science, maybe – to come up with cycles corresponding to rising, falling, and even flat rates.
Here's the Effective Federal Funds Rate if you'd like to follow along.
History of Rising and Falling Federal Funds Rates
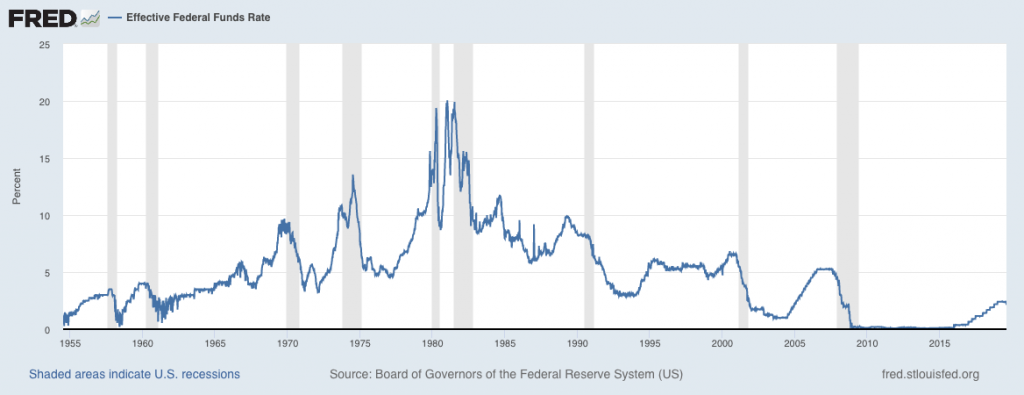
Eyeballing the curve on a weekly chart, we labeled each cycle (or half-cycle) of the Federal Reserve Rate as rising, falling, or flat. We used a weekly chart – we're then a couple days off of the actual policy change, but these dates are close enough.
| Start Date | End Date | Effective Funds Rate Cycle |
| 7/1/54 | 11/13/57 | Rising |
| 11/13/57 | 7/30/58 | Falling |
| 7/30/58 | 5/11/60 | Rising |
| 5/11/60 | 5/3/61 | Falling |
| 5/3/61 | 2/11/70 | Rising |
| 2/11/70 | 3/1/72 | Falling |
| 3/1/72 | 7/3/74 | Rising |
| 7/3/74 | 4/6/77 | Falling |
| 4/6/77 | 4/2/80 | Rising |
| 4/2/80 | 7/23/80 | Falling |
| 7/23/80 | 1/7/81 | Rising |
| 1/7/81 | 3/18/81 | Falling |
| 3/18/81 | 7/8/81 | Rising |
| 7/8/81 | 1/12/83 | Falling |
| 1/12/83 | 8/22/84 | Rising |
| 8/22/84 | 10/15/86 | Falling |
| 10/15/86 | 4/19/89 | Rising |
| 4/19/89 | 7/8/92 | Falling |
| 7/8/92 | 1/5/94 | Flat |
| 1/5/94 | 7/5/95 | Rising |
| 7/5/95 | 9/16/98 | Flat |
| 9/16/98 | 1/6/99 | Falling |
| 1/6/99 | 12/27/00 | Rising |
| 12/27/00 | 7/23/03 | Falling |
| 7/23/03 | 6/23/04 | Flat |
| 6/23/04 | 7/19/06 | Rising |
| 7/19/06 | 8/1/07 | Flat |
| 8/1/07 | 12/17/08 | Falling |
| 12/17/08 | 12/16/15 | Flat |
| 12/16/15 | 7/31/19 | Rising |
| 7/31/19 | ??? | Falling |
So, using our admittedly crude methodology, we're going to say that we have 13 cutting cycles. Here are the start dates:
- 11/13/57
- 5/11/60
- 2/11/70
- 7/3/74
- 4/2/80
- 1/7/81
- 7/8/81
- 8/22/84
- 4/19/89
- 9/16/98
- 12/27/00
- 8/1/07
- 7/31/19
Effects of Rate Cuts on the Stock Market (S&P 500)
With that data in hand, I labeled a chart of S&P 500 prices since 1954 on a log scale. The S&P 500 is a good choice since we have loads of history and it's a broad index. It should show American company resilience to Federal Funds rates.
(See our S&P 500 return calculator).
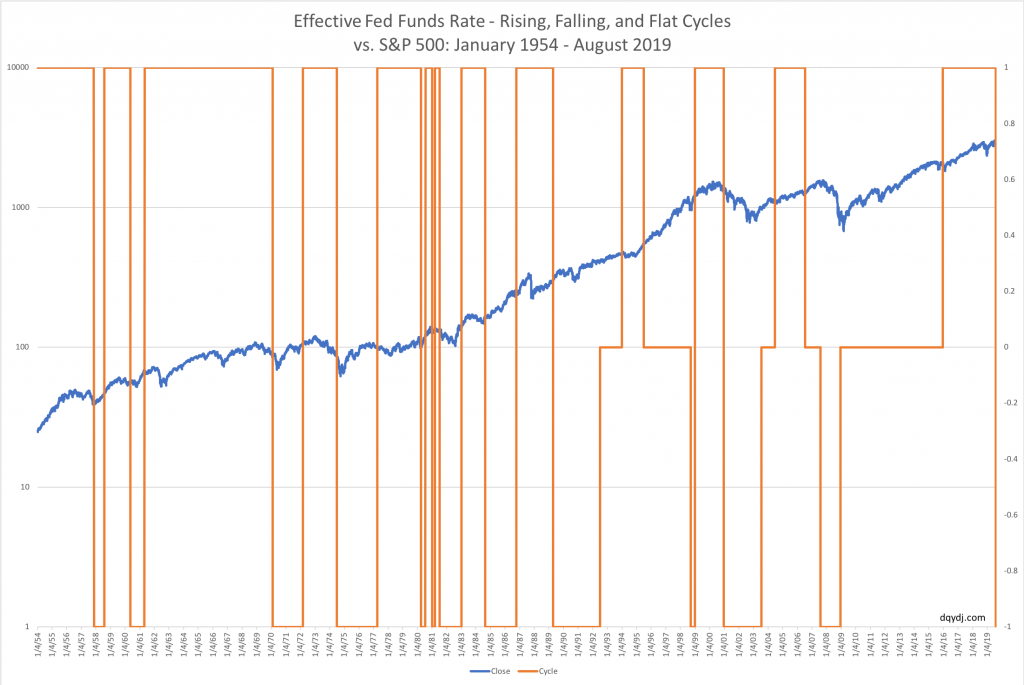
Even on this chart – with a ton going on – you can see that cutting cycles are generally mixed for stocks.
To help a bit, here's the graph of ONLY cutting cycles:
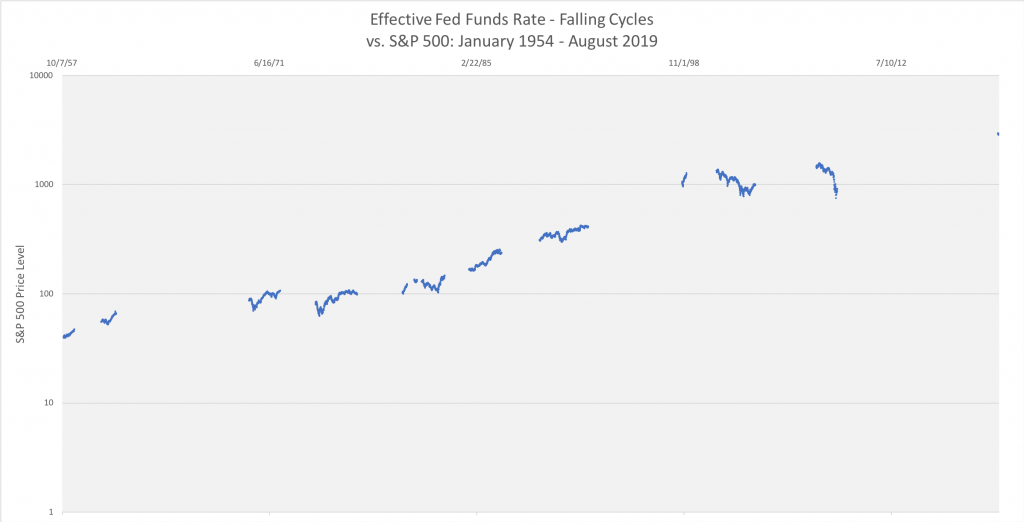
This is a crude study, I agree. But even just eyeballing the chart you can see that falling cycles are often immediately bearish. It's only after more cuts that the S&P 500 starts to rise again.
(And, inevitably, it does rise again.)
So, historically, the Federal Reserve cutting rates was a near-term bearish move... except for maybe the period from 1980 - 2000.
Will This Time be Different?
As we mentioned earlier, the Federal Reserve has quite a few more tools at its disposal now:
- Open market operations entail more abilities to intervene in irrational markets than the past.
- We have more policy tools such as the Taylor Rule which help the Fed stay in front of the economy.
- Measurement is better than ever (arguably, though, forecasting isn't).
- Unlike in previous eras, the Federal Reserve has been willing to pause rates in recent years instead of oscillating between rising and cutting.
But even if you take these advantages into consideration, the last two massive stock market falls were devastating. Both 2000 and 2008 saw 50%+ declines in the price on the S&P 500, even with all of our modern advantages.
Whatever the behavior of the market in cutting cycles in the 80s and 90s, that pattern has switched so far this millennium.
Rate Cuts and the Stock Market in the United States
So, we have our answer: generally, Federal Reserve rate cuts have been bearish in the short term.
The Fed tends to continue its cutting cycles and eventually catches up with the market, so in most periods studied the market recovers by the end of a cutting cycle. This makes sense – the Federal Reserve watches markets, and a plunging market is a sign of trying economic times.
Let that sink in... it's important: a lot of interest rate policy is trying to catch up with the market. If the market is already bearish, the Fed is just playing catch up anyway.
Fed Rate Cuts Aren't Bullish
I'm not the only commentator who has pointed out that Fed Rate cuts aren't as bullish as most people think they are. I'd direct you towards John Hussman (for example, this post) for a parallel perspective. For a contrary perspective, see this post in USA Today on the aforementioned cutting cycles of the 80s and 90s.
Either way, it's not cut and dry. If we're currently in a recession – something we only know in retrospect, by the way – the cut isn't going to help. If investors are still bullish and the Fed cuts, we'll probably emulate the 80s and 90s cutting cycles and rise.
- What's your take?
- Will this cutting cycle bring immediate pain and longer term success?
- Is it bull-on?
- Is this time different?
Let me know what other angles of this data you'd like to see.
