
Below is an industry performance screener and industry stock comparison tool to analyze and compare the performance of companies within the same industry classification. Search by individual ticker or company name, SIC code, NAICS code, or Fama-French 12 industry classification to see performance metrics, charts, and peer comparisons.
Industry Performance Screener and Comparison Tool
How to use the Industry Performance Screener
The screener offers multiple ways to analyze companies and industries. You can search by individual ticker or company name, or explore entire industry classifications using various taxonomy systems.
Search methods and classification systems
For the tool to work, you'll need to pick an industry to screen. But don't worry, I made that straightforward – choose from four classification approaches:
- Individual Ticker: Enter any valid stock ticker in DQYDJ's database to find companies in the same industry and see peer comparisons. You can also search by name
- SIC Codes: Use Standard Industrial Classification codes (e.g., "3571" for Electronic Computers) to find companies by business activity
- NAICS Codes: Search using North American Industry Classification System codes for detailed industry breakdowns
- Fama-French Industries: Select from the 12-industry classification system introduced by Fama and French
Fama-French 12 Industry classification
The Industries tab uses the Fama-French 12 industry classification system, developed by Eugene Fama and Kenneth French. This system groups companies into these sectors:
- Consumer Staples (NoDur): Non-durable consumer goods
- Consumer Discretionary (Durbl): Durable consumer goods like cars and appliances
- Manufacturing (Manuf): Industrial manufacturing and machinery
- Energy (Enrgy): Oil, gas, and energy companies
- Chemicals (Chems): Chemical and materials companies
- Technology (BusEq): Computers, software, and electronic equipment
- Telecommunications (Telcm): Phone, internet, and communication services
- Utilities (Utils): Electric, gas, and water utilities
- Retail (Shops): Wholesale, retail, and some services
- Healthcare (Hlth): Medical equipment, drugs, and healthcare services
- Financial Services (Money): Banks, insurance, and real estate
- Other: Companies not classified in the above industries
If you click over to the Industries tab in the search box, you can select one of those 12 and populate the table.
Aggregating by SIC and NAICS codes
The tool supports both SIC and NAICS classification systems:
- SIC Codes: The older Standard Industrial Classification system, still widely used. For example, SIC 6021 represents National Commercial Banks
- NAICS Codes: The newer North American Industry Classification System with more detailed subcategories. Example: NAICS 541511 for Custom Computer Programming Services
The tool automatically suggests matching codes as you type, helping you find the right industry classification. Alternatively, look up a ticker in the SIC and NAICS lookup tool first, then bring the SIC or NAICS codes you're interested in researching back here.
Performance metrics and analysis
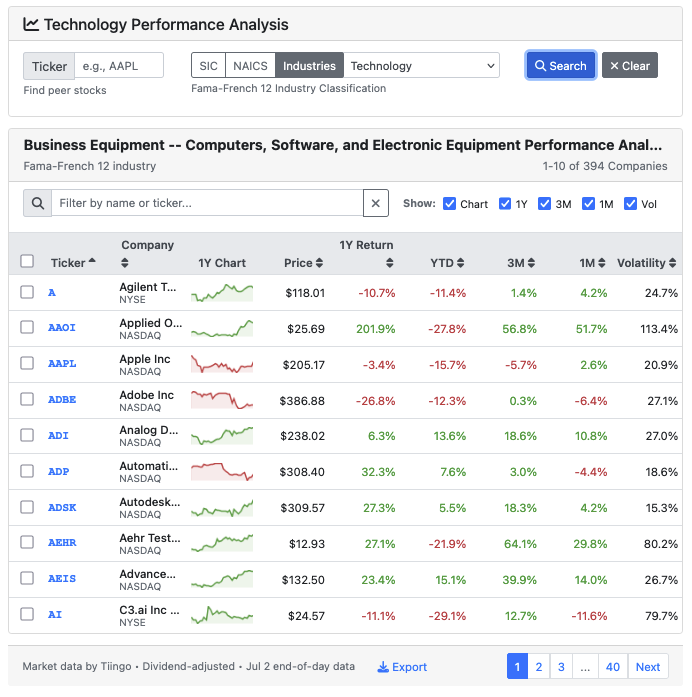
For each company in your selected industry, the screener displays:
- Current Price: Latest stock price from market data
- 1-Year Return (%): Total return over the past 12 months
- YTD Return (%): Year-to-date performance
- 1-Year Price Chart: Interactive sparkline showing price movement over the past year
- Company Information: Company name, exchange, and security type
Additional metrics available
I've also built the tool to have a few columns off by default. Click the column visibility controls to reveal additional performance metrics:
- 3-Month Return (%): Quarterly performance showing recent trends and momentum
- 1-Month Return (%): Short-term price movement for identifying recent catalysts
- 30-Day Volatility (%): Annualized volatility measure indicating price
stability and risk
Advanced features and interactivity
But wait, there's more! You probably would have discovered these clicking around, but if you want to take your analysis further:
- Sortable Columns: Click any column header to sort companies by that metric
- Bulk Comparison: Select multiple companies to compare their performance side-by-side
- Detailed Perofmance: Click through to individual stock returns by hitting the link exposed via the ticker
- Export data: Export your data to a CSV to run your own analysis
Sources for the Industry Performance Screener
The tool integrates multiple authoritative data sources to provide comprehensive industry analysis:
Data Sources and APIs
- Market Data: I use the Tiingo API for EOD stock prices and historical data, and use that to compute performance metrics
- Company Classifications: The SEC's EDGAR database provides the SIC codes and business descriptions
- Industry Mappings: Kenneth French's data library has SIC-to-Fama-French 12 industry classification mappings
- NAICS Classifications: U.S. Census Bureau NAICS official classification system, using the NAICS Association crosswalks from the SIC codes populated from SEC EDGAR
Rate Limits and Usage
There's a lot of data here, and as you can imagine the tool is doing quite a bit in the background. that in mind, there are some mild usage limitations:
- Market data may be up to 7 days old (though I do strive to update popular queries every 24 hours)
- Industry screener usage: there is a maximum number of actions you can take per minute and per day. Come back tomorrow if you hit the limit (remember: you can also export data and do calculations offline)
- Large industry groups may take 30-60 seconds to fully load as data is processed
Limitations and Disclaimers
Industry classifications and performance metrics are for informational and research purposes only. I cannot warrant the accuracy of industry groupings or performance calculations. You should work with a financial professional before making any investment decisions and verify all figures from other sources.
Important limitations include, but are not limited to:
- Industry classifications may not reflect current business mix for diversified companies
- Performance calculations are idealized and don't account for transaction costs, taxes, or timing
- Splits, spinoffs, and other corporate events can affect ranking in the tools
- Historical performance does not guarantee future results
- Data may contain errors or omissions from source providers
Related Financial Analysis Tools
Enhance your research with our comprehensive suite of financial calculators:
- Stock Return Calculator - Individual stock performance with dividend reinvestment
- Stock Correlation Calculator - Analyze performance relationships between individual stocks
- Stock Drawdown Calculator - Maximum loss and volatility analysis
- ETF Return Calculator - Exchange-traded fund performance analysis (see? I don't only make stock tools!)
- SIC and NAICS Code Lookup - Find industry classifications for any company... then come back here and look things up!
Understanding Industry Analysis for Investment Research
Industry analysis is a fundamental component of investment research. The financial media doesn't generally talk about performance until after it's already happened and pretty obvious from online conversations. If there's an edge out there, you need to do differentiated research to find it.
I'm not just making this up – you're all the way into my conclusion, after all! – but working through this tool's development gave me a lot of investment ideas to pursue in various sectors.
Anyway, here's my take on where you might use this:
- Identify Industry Peers: Find companies outperforming – or underperforming – their peers
- Spot Trends: Understand at a glance whether industries are growing or declining
- Assess Relative Value: Compare performance metrics across similar companies
- Diversification Planning: Understand sector concentration in portfolios
Let me know how you use the tool – and send me your ideas for enhancements! Consider this a draft of what this tool might become.
