
In 2015, we estimate there were between 3,357,626 and 4,185,114 people working in a role which required software development.
Furthermore, we estimate that between 2.00% and 2.50% of all workers in America had a development related role in 2015.
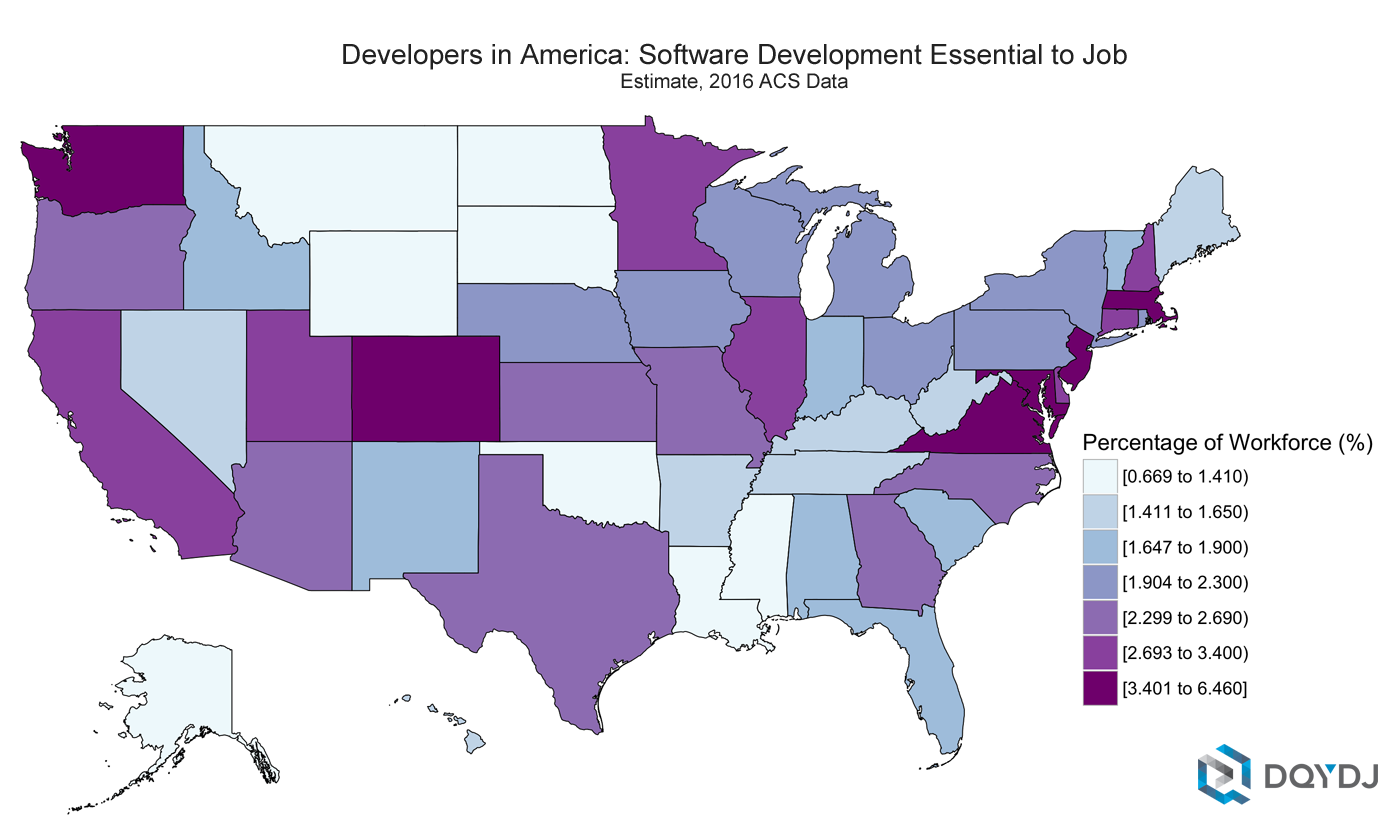
Which States Have the Highest Concentration of Developers?
Washington D.C. had the highest percentage of developers - a full 6.46% of workers living there met our extended definition.
Virginia and Maryland came in second and third, at 4.43% and 4.41%, respectively.
At an absolute level, California, Texas and New York of course led the way - with 628,414, 324,717, and 218,041 workers respectively. (Virginia was the surprise at #4 with 204,699).
The Number of Developers in America and Number of Developers Per State
As a check on these numbers we direct you to Evans Data Corporation, who host the most extensive biannual report on developers worldwide. Also of interest is Janel Garvin's blog (Evans's CEO), where she writes on some key insights from their survey.
Evans pegs the number of worldwide developers - including hobbyists who can also code - around 21,000,000. In North America they put the number of developers around 4.4 million. This fits excellently with our estimates, especially considering we're not factoring in retired developers or hobbyists.
Raw Number of Developers by State
Here's our state-by-state and DC breakdown for the number of developers (see category methodology below the table):
| State | Total Workers | Strict Devs | Group 2 | Group 3 | Percentage (G3) |
| ALABAMA | 2,292,653 | 32,957 | 40,114 | 42,665 | 1.86% |
| ALASKA | 422,404 | 2,749 | 2,792 | 3,257 | 0.77% |
| ARIZONA | 3,291,556 | 58,063 | 69,460 | 75,685 | 2.30% |
| ARKANSAS | 1,419,899 | 18,849 | 20,910 | 22,878 | 1.61% |
| CALIFORNIA | 19,928,185 | 514,258 | 585,885 | 628,414 | 3.15% |
| COLORADO | 3,091,017 | 90,548 | 101,237 | 107,423 | 3.48% |
| CONNECTICUT | 1,987,954 | 41,708 | 47,980 | 53,543 | 2.69% |
| DELAWARE | 498,732 | 12,973 | 13,877 | 15,759 | 3.16% |
| DISTRICT OF COLUMBIA | 414,197 | 13,881 | 14,730 | 26,749 | 6.46% |
| FLORIDA | 9,902,707 | 148,626 | 166,688 | 181,314 | 1.83% |
| GEORGIA | 5,137,644 | 105,786 | 117,292 | 129,145 | 2.51% |
| HAWAII | 776,908 | 8,434 | 9,281 | 10,961 | 1.41% |
| IDAHO | 858,200 | 12,851 | 15,316 | 16,135 | 1.88% |
| ILLINOIS | 6,814,110 | 145,339 | 169,897 | 186,426 | 2.74% |
| INDIANA | 3,451,803 | 42,748 | 53,966 | 56,862 | 1.65% |
| IOWA | 1,760,302 | 27,816 | 33,571 | 36,552 | 2.08% |
| KANSAS | 1,605,383 | 31,012 | 35,381 | 38,170 | 2.38% |
| KENTUCKY | 2,184,858 | 25,490 | 30,079 | 32,262 | 1.48% |
| LOUISIANA | 2,261,354 | 19,773 | 22,711 | 24,641 | 1.09% |
| MAINE | 738,472 | 7,998 | 9,319 | 10,758 | 1.46% |
| MARYLAND | 3,341,841 | 107,123 | 120,267 | 147,430 | 4.41% |
| MASSACHUSETTS | 3,898,211 | 116,517 | 132,134 | 141,755 | 3.64% |
| MICHIGAN | 5,056,465 | 84,190 | 105,663 | 115,359 | 2.28% |
| MINNESOTA | 3,215,546 | 77,125 | 86,526 | 94,211 | 2.93% |
| MISSISSIPPI | 1,351,418 | 8,795 | 10,940 | 11,845 | 0.88% |
| MISSOURI | 3,204,308 | 62,938 | 68,211 | 73,757 | 2.30% |
| MONTANA | 560,430 | 4,138 | 5,291 | 5,848 | 1.04% |
| NEBRASKA | 1,089,994 | 17,212 | 18,773 | 20,755 | 1.90% |
| NEVADA | 1,482,766 | 17,998 | 19,407 | 21,314 | 1.44% |
| NEW HAMPSHIRE | 787,361 | 22,090 | 25,519 | 26,359 | 3.35% |
| NEW JERSEY | 4,792,291 | 138,970 | 152,145 | 162,977 | 3.40% |
| NEW MEXICO | 990,639 | 12,313 | 15,332 | 18,210 | 1.84% |
| NEW YORK | 10,425,481 | 178,358 | 198,758 | 218,041 | 2.09% |
| NORTH CAROLINA | 5,121,123 | 100,641 | 116,337 | 125,937 | 2.46% |
| NORTH DAKOTA | 451,910 | 4,463 | 5,778 | 6,306 | 1.40% |
| OHIO | 6,142,764 | 105,506 | 127,263 | 136,615 | 2.22% |
| OKLAHOMA | 1,960,479 | 20,866 | 24,435 | 27,026 | 1.38% |
| OREGON | 2,127,040 | 41,969 | 50,330 | 52,800 | 2.48% |
| PENNSYLVANIA | 6,799,310 | 122,733 | 141,485 | 152,900 | 2.25% |
| RHODE ISLAND | 586,787 | 8,109 | 9,983 | 11,370 | 1.94% |
| SOUTH CAROLINA | 2,442,974 | 31,305 | 39,930 | 42,587 | 1.74% |
| SOUTH DAKOTA | 485,754 | 5,760 | 6,444 | 6,709 | 1.38% |
| TENNESSEE | 3,351,337 | 43,801 | 50,756 | 54,123 | 1.61% |
| TEXAS | 14,020,718 | 267,944 | 301,297 | 324,717 | 2.32% |
| UTAH | 1,563,660 | 36,285 | 40,493 | 43,842 | 2.80% |
| VERMONT | 375,328 | 4,574 | 5,781 | 6,896 | 1.84% |
| VIRGINIA | 4,625,253 | 161,608 | 174,841 | 204,699 | 4.43% |
| WASHINGTON | 3,837,659 | 123,932 | 135,904 | 143,971 | 3.75% |
| WEST VIRGINIA | 841,955 | 10,401 | 11,269 | 12,037 | 1.43% |
| WISCONSIN | 3,274,587 | 56,231 | 68,589 | 72,878 | 2.23% |
| WYOMING | 334,903 | 1,872 | 2,043 | 2,241 | 0.67% |
| Totals | 167,378,630 | 3,357,626 | 3,832,410 | 4,185,114 | 2.50% |
Source and Methodology for The Number of Developers in America and Per State
We got our data on the number of developers in the United States and the number of developers per state from the 2016 data release of the ACS. Value was added to the microdata by the University of Minnesota's Minneosta Population Center:
Steven Ruggles, Katie Genadek, Ronald Goeken, Josiah Grover, and Matthew Sobek. Integrated Public Use Microdata Series: Version 6.0 [dataset]. Minneapolis: University of Minnesota, 2015. http://doi.org/10.18128/D010.V6.0.
Other Geographic Breakdowns of Developers
We continued the series with a number of articles looking at developer breakdown with other geographies. They all build off the methodology in this article, so are directly comparable:
- (Zip Code) Developer Breakdown by Zip Code
- (County) Software Professionals by County
- (CBSA) Core Based Statistical Area Software Professional Breakdown
- (CSA) Developers per Combined Statistical Area
Coming Up With An Agreeable Definition of 'Developer'
There are many job descriptions in the BLS's 2010 update of the occupation labels. No matter how we slice it there's bound to be disagreement as to who constitutes a 'developer' or who requires familiarity with code at work . We'll take a shot anyway. If you disagree with our picks, feel free to rerun the numbers and we'll link to your results.
How did We Define a 'Strict' Developer?
Our goal for this category was for pure software developers. We started with the core developer, programmer, and DBA categories from the BLS. It misses some obvious software professions such as embedded (or "IoT") and driver developers, but is a good core estimate and the bulk of developers in America (roughly 80% of our final set).
- 1000 Computer Scientists and Systems Analysts/Network systems Analysts/Web Developers
- 1010 Computer Programmers
- 1020 Software Developers, Applications and Systems Software
- 1060 Database Administrators
How Did We Extend Developers for Our Second Set?
Our second grouping includes all of the professionals in the strict categories above, plus other professionals who almost certainly are either writing or reading code on a regular basis.
This includes the aforementioned workers in the Electrical and Hardware Engineering categories, as well as Technical Writers, CAD Programmers and Operators and the like. I've also included Sales Engineers, positions which are usually filled with folks who were previously in an engineering role. This bucket consists of roughly 475,000 people.
(For the record, my formal education would fall into this grouping.)
- 1400 Computer Hardware Engineers
- 1410 Electrical and Electronics Engineers
- 2840 Technical Writers
- 4930 Sales Engineers
- 7900 Computer Control Programmers and Operators
How Did We Define Our Most Expansive Set of Developers?
Although this category will be controversial, we tried to estimate the number of other people writing scripts and code outside of software and electrical engineering. Actuaries, statisticians, analysts, mathematicians and economists often use SAS, STATA, Mathematica and (this article's enabler...) R. Others use Matlab, Octave, Sage, Excel and OpenOffice as well as traditional languages Perl and Python.
Group 3 includes the first two groups and:
- 0820 Budget Analysts
- 0830 Credit Analysts
- 0840 Financial Analysts
- 1200 Actuaries
- 1220 Operations Research Analysts
- 1230 Statisticians
- 1240 Mathematical science occupations, nec
- 1800 Economists and market researchers
- 5920 Statistical Assistants
More Notes on Our Selections
To make it very clear - all the data in the article is for people who worked or earned a living from (at least partially) development in 2015.
We didn't attempt to estimate developers who no longer work in these categories, or those with development training in school. Additionally, we didn't try to add hobbyist developers to the mix as in the Evans' data. Notably though, we do include self-employed developers in all above categories.
Also, we assuredly left out many categories of worked who tangentially write code.
Certainly some of the other science and engineering disciplines write a fair amount of code (a lot of them in Perl!).
If your target is "anyone trainable in a few months", our estimates are low. If you're looking for anyone "who could start coding within a couple weeks", look at Group 2 and Group 3.
The Number of Developers in America
We hope this article was as interesting to you as the research was to us. It goes to show that there are quite a few people in the United States who are required to be proficient in - or at least familiar with - code.
Whether you gravitate towards the 3.4 million number or the 4.2 million number is personal preference. Feel free to let us know which one is most defensible
