
On this page is a Shiba Inu Daily Moving Average Calculator. This tool helps analyze the daily moving averages of Shiba Inu (SHIB) over a selected timeframe. You can calculate and visualize daily moving average crossovers, which can indicate potential bullish or bearish trends. 🚀
How to Use the Shiba Inu Daily Moving Average Calculator
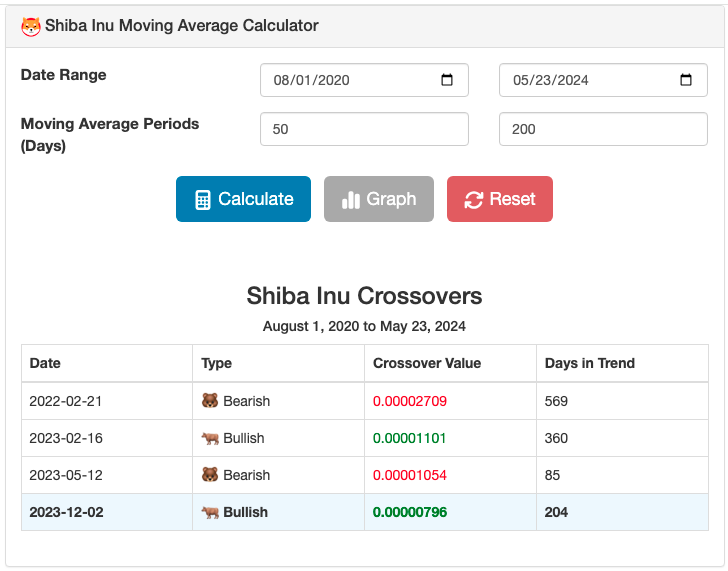
To effectively use this tool to analyze daily moving averages in your Shiba Inu investment strategy, follow these steps (wow, so easy!):
- Starting Date: Enter the date when you want to start analyzing moving averages.
- Ending Date: Enter the date when you want to stop analyzing moving averages.
- Moving Average Periods: Input the number of days for the two moving average periods you want to compare.
- Calculate: Click the Calculate button to view the moving averages and potential crossovers (wow, such math!).
- Graph: Click the Graph button to visualize the moving averages and crossovers on a chart.
Understanding moving average crossovers is useful, as they can indicate potential bullish or bearish trends in the value of Shiba Inu, providing insights into market momentum.
Special features
The Shiba Inu Daily Moving Average Calculator offers a few unique features:
- Moving Average Calculation: Calculates the moving averages for the specified periods over the selected date range.
- Crossovers: Identifies potential bullish and bearish crossovers, helping you understand market trends.
- Interactive Graphs: Visualize moving averages and crossovers with interactive charts that highlight key points. The chart subtitle displays the current trend, and all crossovers are labeled with 📈 or 📉 for bullish and bearish, respectively.
Why moving averages matter for Shiba Inu
Moving averages are a popular technical analysis tool used to smooth out price data and identify trends in cryptocurrencies like Shiba Inu (wow, such analysis!).
A common strategy is to use two moving averages of different lengths, such as the 50-day and 200-day moving averages. When the shorter moving average crosses above the longer one, it can signal a bullish trend (known as a "golden cross"). Conversely, when the shorter moving average crosses below the longer one, it can signal a bearish trend (known as a "death cross").
For more information on moving averages and their significance, visit the CME Group's guide to Moving Averages and Meb Faber's timing model.
Methodology and Data Sources
The calculator uses historical price data for Shiba Inu from CoinGecko. We've also built a Shiba Inu Return Calculator, a Shiba Inu Drawdown Analyzer, a USD to Shiba Inu converter, and a Shiba Inu to USD tool.
Disclaimer
While we strive to provide accurate and up-to-date information, the results from this calculator are for informational purposes only and should not be considered financial advice. Past performance is not a guarantee of future returns. Conduct your own research, and always consult with a financial advisor before making investment decisions.
We hope this tool aids you in making informed decisions about Shiba Inu investments. For more financial tools, check out our Investing category page.
