
With the price of homes in the United States at new peaks, you're probably wondering how people are paying for these purchases. Luckily, thanks to the FHFA and CFPB's National Survey of Mortgage Originations, we have high quality data on home purchasers who use mortgages to buy property.
This post will look at statistics on the source of funds for home purchases – either down payments or other costs. The survey includes data on purchasers who took out a new mortgage to buy a property in the United States from 2013 through 2019.
Source of Funds for Home Purchases
First, let's take a look at how people bought all types of homes between 2013-2019. This section includes primary residences, secondary homes, rental property, homes purchased for relatives, buildable lots, and "other" residences.
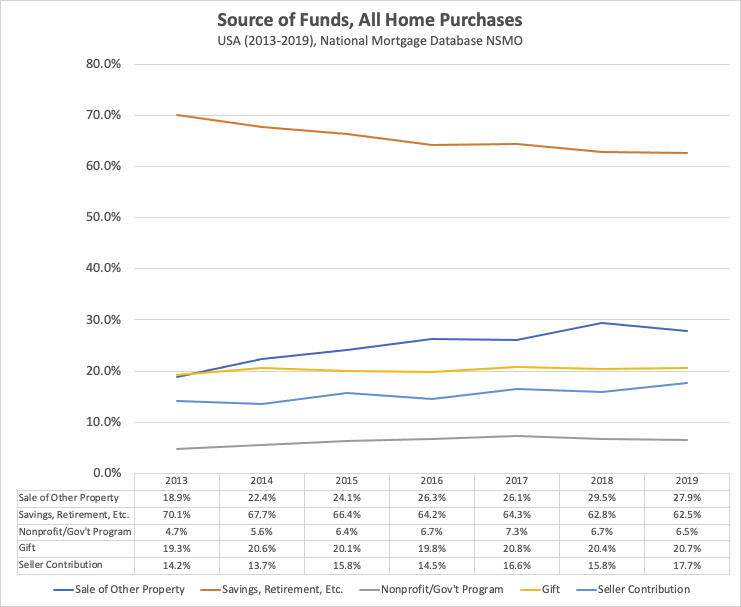
The below chart shows five of the National Survey of Mortgage Originations' categories for sources of funds along with how many buyers employed the source per year. Some borrowers used more than one source – the numbers don't add up to 100%.
Here's the data in table form, if you'd prefer something more copy/pastable:
| Year | Sale of Other Property | Savings, Retirement, Etc. | Nonprofit/Gov't Program | Gift | Seller Contribution |
| 2013 | 18.9% | 70.1% | 4.7% | 19.3% | 14.2% |
| 2014 | 22.4% | 67.7% | 5.6% | 20.6% | 13.7% |
| 2015 | 24.1% | 66.4% | 6.4% | 20.1% | 15.8% |
| 2016 | 26.3% | 64.2% | 6.7% | 19.8% | 14.5% |
| 2017 | 26.1% | 64.3% | 7.3% | 20.8% | 16.6% |
| 2018 | 29.5% | 62.8% | 6.7% | 20.4% | 15.8% |
| 2019 | 27.9% | 62.5% | 6.5% | 20.7% | 17.7% |
How many home purchasers used the equity in another property for a home purchase?
While one question in the survey asks whether borrowers sold another property to fund a home purchase, there's another way to use accumulated equity: borrow on that property to raise funds.
Starting in the 7th version of the survey, the NSMO asks whether people use "A second lien, home equity loan, or home equity line of credit (HELOC)" to help pay. Here's how many buyers used existing equity in creative ways to come up with money needed to take out a new purchase mortgage.
| Year | Other Equity |
| 2015 | 3.4% |
| 2016 | 3.3% |
| 2017 | 3.0% |
| 2018 | 3.0% |
| 2019 | 3.2% |
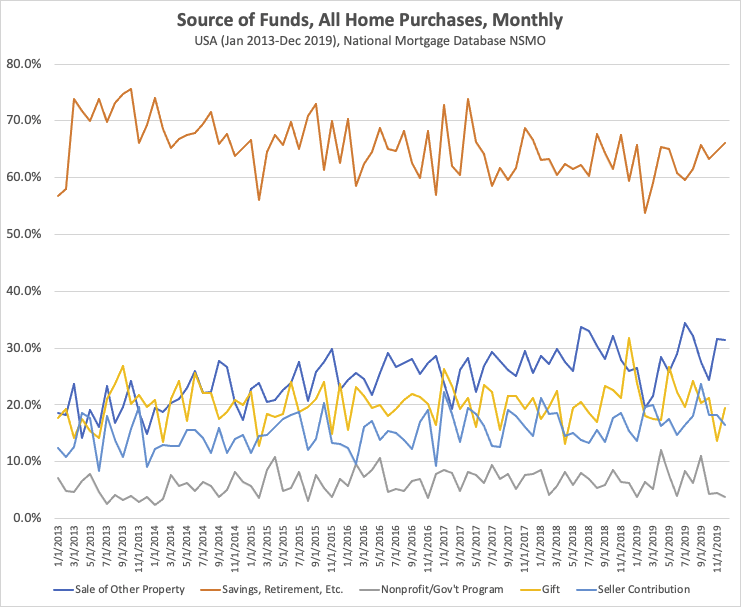
Is there any seasonality to how people purchase homes?
There's seasonality to home-buying most years. With children out of school – and better weather – early summer to early fall in the United States is the strongest selling season with the most inventory.
(We'll see next year how COVID has changed that pattern.)
Unfortunately, the data is just too noisy to see clear home purchase source of funds seasonal trends. But don't take my word for it – I graphed it for you:
Primary Home Purchase Source of Funds
You're likely most interested in statistics on people buying homes as primary residences. This next chart isolates only people who reported taking out a mortgage to purchase a home as a primary residence, along with people who will "soon" make their purchase a primary residence.
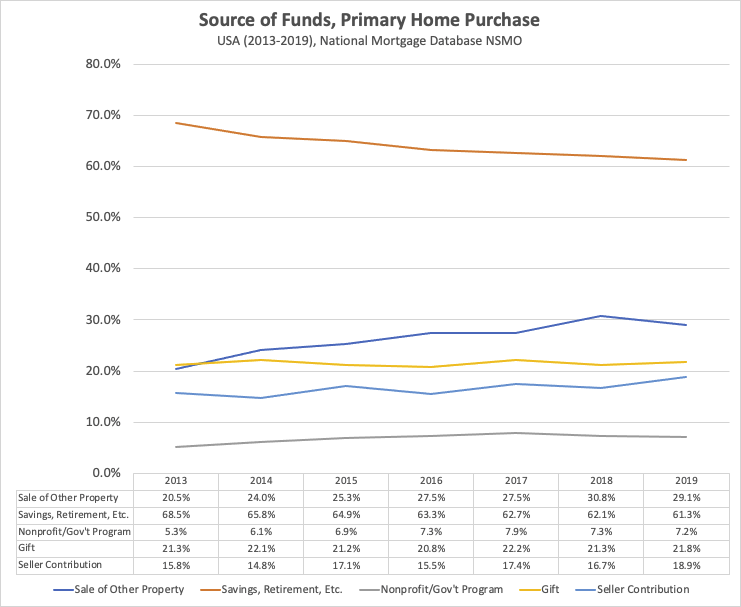
And here, again, is a table with all of the data presented in an easy format to copy and paste:
| Sale of Other Property | Savings, Retirement, Etc. | Nonprofit/Gov't Program | Gift | Seller Contribution | |
| 2013 | 20.5% | 68.5% | 5.3% | 21.3% | 15.8% |
| 2014 | 24.0% | 65.8% | 6.1% | 22.1% | 14.8% |
| 2015 | 25.3% | 64.9% | 6.9% | 21.2% | 17.1% |
| 2016 | 27.5% | 63.3% | 7.3% | 20.8% | 15.5% |
| 2017 | 27.5% | 62.7% | 7.9% | 22.2% | 17.4% |
| 2018 | 30.8% | 62.1% | 7.3% | 21.3% | 16.7% |
| 2019 | 29.1% | 61.3% | 7.2% | 21.8% | 18.9% |
Primary Home Purchase Equity Purchases
Here is data from 2015 until 2019 tabulating how many borrowers used equity in another property to purchase a primary home.
| Year | Other Equity |
| 2015 | 2.7% |
| 2016 | 2.7% |
| 2017 | 2.5% |
| 2018 | 2.5% |
| 2019 | 2.7% |
Home Purchase Source of Funds Methodology
All data comes from the National Survey of Mortgage Originations.
This data is on mortgages between January 2013 and December 2019. As it can take mortgages more than six months to show up on a credit report, the earliest we'd even possibly see 2020 data is late 2021.
All the data on sample sizes is in the survey technical documentation [PDF]. The codebook [PDF] has the exact question text per wave and some of the technical details.
The relevant questions and variables for this analysis:
- x33 – only look at borrowers who took out a mortgage to buy a property
- x36a - x36f – tabulate buyer source of funds
- x66 – see if it was a primary home purchase (or will be a primary home soon)
- analysis_weight – weight the responses
- open_year / open_month – when the mortgage was originated
What is a seller contribution?
Most of the categories are straightforward, but seller contribution might be a surprise. A seller contribution – sometimes a seller concession – is when the seller pays any of the costs traditionally paid by a buyer. For a conforming mortgage, usually, this can't include contributions to the down payment. Other costs, including closing costs, are on the table.
Fannie Mae's interested party contributions guide also shows some of the conforming mortgage contribution limits.
Paying for a House
There are certainly some interesting datapoints in the NSMO. At a glance, you'll note Americans have reduced their reliance on savings while increasing their reliance on selling other properties. All the while, the percentage of purchases which employ a monetary gift has stayed constant.
Of course, this is only data on purchases where the buyer used a mortgage. Cash buyers – including those who later cash-out refinance – have a different approach. But especially for primary home buyers, this is a good take on the standard path to home ownership.
COVID-19 and the ensuing 2020-2021 market certainly shook things up. We'll see how things changed when the next update posts.
Related content:
