
Below is a standard deviation calculator, which will calculate the standard deviation from a list of numbers. Input numbers (including negative numbers or decimals) and the tool will return the standard deviation.
The calculator can work either as a sample standard deviation calculator or a population standard deviation calculator.
Standard Deviation Calculator
What is the Standard Deviation of a Set of Numbers?
The standard deviation of a set of numbers is a measure of dispersion of those numbers. In essence, it's a number which (with the average) describes or summarizes the range and shape of a set.
A higher standard deviation means that samples are more varied, or "further apart". Smaller standard deviations mean that a measure has a tighter cluster.
There are two "types" of standard deviation:
- Sample standard deviation – standard deviation measured from a sample, not the entire whole (known as a population). This is the most common form – you almost always should use this.
- Population standard deviation - the standard deviation measured from the entire population (e.g. all people)
Standard Deviation and the Normal Distribution
A normal distribution is a continuous probability distribution of a random variable, evenly and randomly dispersed around a mean or average. It's also known as a Gaussian distribution. Height is an excellent real world example – you can see the height distribution in the United states here.
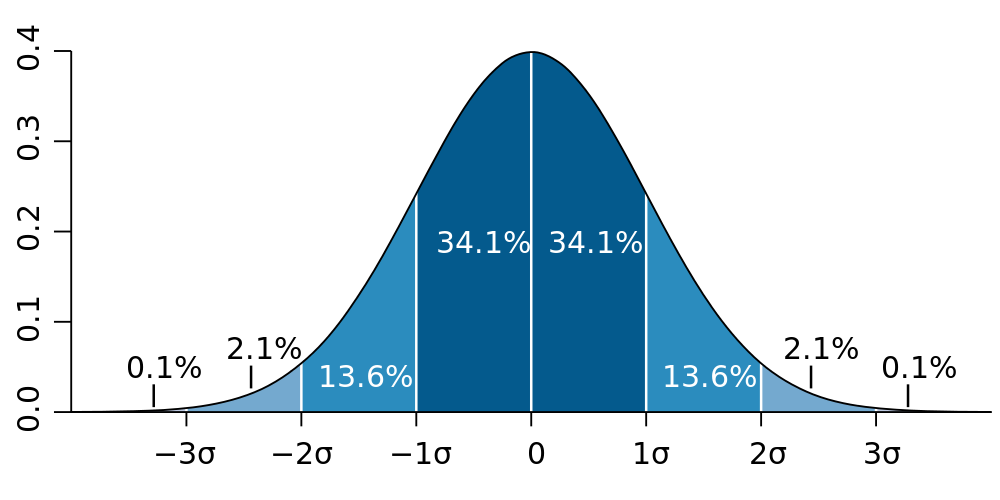
In a perfect normal distribution, the average, median, and mode are all centered at point 0. One standard deviation in either direction – with enough random samples – covers 34.1% of samples, or 68.2% if you add them together.
In this world, the data is well described by:
- +/- 1 δ: 68.2% of samples
- +/- 2δ: 95.4% of samples
- +/- 3δ: 99.7% of samples
However, the normal distribution doesn't always apply...
Where a Standard Deviation Doesn't Fit
Not all data behaves normally or is perfectly randomly distributed around a whole – many things are said to have fat tails. That is, the far left and right of their theoretical distribution don't move nicely towards 0 percentage like the above ideal normal distribution graph.
Often in fields like finance and economics, events that are 'rare' if estimated from a Gaussian model are instead likely or even inevitable in certain conditions. Income distribution, net worth distribution, market crashes, wars, pandemics, and other events are all "in the realm of possibility" but don't fit a Gaussian model.
In practice, sometimes it is easier to inappropriately use normal distributions to explain things that we know have fat tails. (See, for example, the Black-Scholes derivative pricing model). Just remember, for many important subjects: the map isn't the territory – don't be fooled by the false hope implied by the skinny tales of a normal distribution.
Standard Deviation Formula
As there are two standard deviation measurements (for samples and population), there are two slightly different standard deviation formulas. For either one, you need to first compute or estimate or otherwise find the mean or average.
Population Standard Deviation Formula
The formula for population standard deviation is:
Where:
- δ = population standard deviation
- N = number in the population
- xi = observation in the population
- μ = the mean in the population
Sample Standard Deviation Formula
The formula for sample standard deviation is:
Where:
- s = sample standard deviation
- n = number of observations in the sample
- xi = observations in the sample
- m = the mean of the sample
Examples of Finding a Standard Deviation
Normally, you won't have the opportunity to measure an entire population - practicality (or resources!) often limit that. Let's walk through computing standard deviation of a sample.
Pretend you measured 5 adult men and found they weigh: 140, 170, 200, 210, and 320 pounds. Their average weight is 208 lbs.
Find the difference for each one and the sample mean:
Next, square each number:
Now, add the numbers up and divide by 4. (If we were looking at the whole population we would instead divide by 5.)
At this point, you have the sample variance. However, the variance is expressed in units that don't make sense (once we find the standard deviation it will be in pounds).
At this point, take the square root to find the standard deviation:
Using the Standard Deviation Calculator
To use the standard deviation calculator, enter your entire set of numbers in the Enter Numbers text field. The input is forgiving – be sure to separate numbers and it should work. Try using commas, spaces, new lines, tabs, and so on. In the Type pulldown, choose if you want the standard deviation of a Population or Sample.
The calculator updates in real-time as you type. The Summary Statistics section shows count, mean, sum, variance, standard deviation, and range for your data set.
