
Below is a Stock Daily Moving Average Calculator. Analyze two daily moving averages of a length you choose of a stock over a selected timeframe, and graph or output DMAs and crossovers. Contains data for thousands of American Stocks and ADRs, updated within the previous seven days.
Using the Stock Daily Moving Average Calculator
To effectively use this tool to analyze daily moving averages in a stock investment, follow these steps:
- Ticker: Enter the stock ticker symbol you want to analyze. The tool will auto-complete as you type, helping you find the correct symbol.
- MA Period 1 (Days)/ MA Period 2 (Days): Enter the number of days for the two moving average periods you want to compare (e.g., 50 and 200 days).
- Starting Date: Enter the date when you want to start analyzing moving averages.
- Ending Date: Enter the date when you want to stop analyzing moving averages.
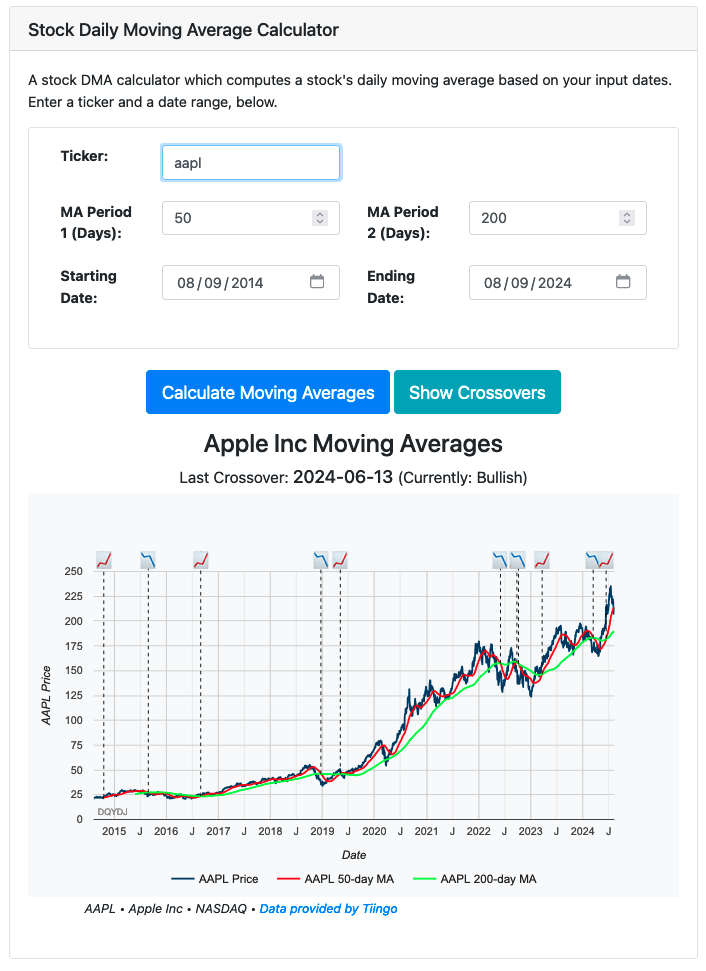
- Calculate: Click the Calculate button to view the moving averages and crossovers on a chart.
- Show Crossovers: Click this button to display a table of crossovers, whether that crossover was bullish or bearish, the length the stock was in that period, and the value of the DMAs at the crossover.
Understanding moving average crossovers is valuable for stock analysis. They can indicate potential bullish or bearish trends in stock prices, providing insights into market momentum.
Special features
Our Stock Daily Moving Average Calculator offers several unique features:
- Moving Average Calculation: Calculates the moving averages for the specified periods over the selected date range.
- Crossover Detection: Identifies and marks bullish and bearish crossovers on the chart, helping you understand market trends.
- Interactive Graphs: Visualize stock prices, moving averages, and crossovers with interactive charts. The current trend is displayed in the chart subtitle, and all crossovers are labeled with 📈 or 📉 for bullish and bearish signals, respectively.
- Crossover Table: Displays a detailed table of all crossovers, including the date, type (bullish or bearish), value (split-adjusted), and the number of days the previous trend lasted.
Why moving averages matter
Moving averages are a popular technical analysis tool used to smooth out price data and identify trends in stock prices. They help filter out the noise from short-term price fluctuations, and provide a clearer picture of the overall trend.
A common strategy is to use two moving averages of different lengths, such as the 50-day and 200-day moving averages. When the shorter moving average crosses above the longer one, it can signal a bullish trend (known as a "golden cross"). Conversely, when the shorter moving average crosses below the longer one, it can signal a bearish trend (known as a "death cross").
For more information on moving averages and their significance in stock analysis, visit the Investopedia guide to Moving Averages.
Methodology and data sources
The calculator uses historical price data for stocks from Tiingo. It does not account for reinvested dividends; for dividend reinvestment, use the stock total return calculator. I also built a tool to analyze a stock's past drawdowns, a SIC and NAICS lookup tool, and a stock correlation calculator.
Disclaimer
While we strive to provide accurate and up-to-date information, the results from this calculator are for informational purposes only and should not be considered financial advice. Past performance is not a guarantee of future returns. Always conduct your own research and consult with a financial advisor before making investment decisions.
We hope this tool aids you in making informed decisions about your stock investments. For more financial tools, check out our Investing category page.
