
A bear market occurs when a stock index or stock is down 20% from its all-time high (often abbreviated ATH) trading price. Due to pessimism with the future course of company earnings, investors bid down stock trading prices. Bear markets are usually – although not always – accompanied by an economic recession or decline in economic output in a country or region.
2018: A Bear Market in the S&P 500
On Christmas Eve 2018 the S&P 500 – the most watched United States stock index – officially entered a bear market.
Intraday on September 21, 2018 the S&P 500 briefly touched its all time high of 2,940.91. On December 24, 2018 the S&P 500 closed at 2,351.10... just clearing the bear threshold at a -20.06% drop.
Before that, there have been multiple corrections after new all time highs set post-Great Recession. The last bear market began March 17, 2008, and there wasn't a new (nominal) market high in the S&P 500 between October 11, 2007 and April 09, 2013. That's 2,007 calendar days... and 1,382 trading days.
A technical note: check out our S&P 500 return calculator which includes inflation and dividend reinvestment with a monthly cadence. Including inflation, in some cases, makes the bear markets appear even worse...
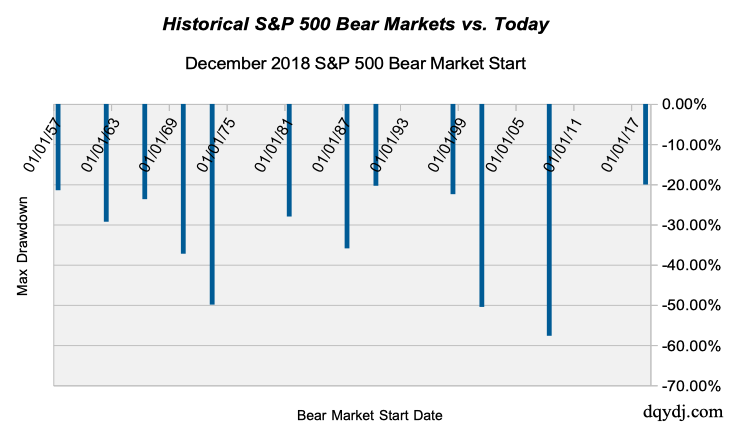
How Do Historical Bear Markets in the S&P 500 Behave?
We looked at the nominal (read: price) performance of the S&P 500 from January 1950 until today. (You can grab the data yourself from Yahoo!.) Using the daily high and low price point, we graphed all bear markets and stock market corrections since then.
| Bear Market Start | Last ATH | Next ATH | Trough | Max Decline | Peak Until Bear | Days Between Peaks |
| 10/21/57 | 08/02/56 | 09/24/58 | 10/22/57 | -21.47% | 445 | 782 |
| 05/28/62 | 12/12/61 | 08/30/63 | 06/25/62 | -29.31% | 167 | 625 |
| 08/29/66 | 02/09/66 | 04/28/67 | 10/10/66 | -23.69% | 201 | 442 |
| 01/26/70 | 12/02/68 | 03/06/72 | 05/26/70 | -37.27% | 420 | 1189 |
| 11/26/73 | 01/11/73 | 07/17/80 | 10/04/74 | -49.93% | 319 | 2743 |
| 09/25/81 | 11/26/80 | 11/03/82 | 08/09/82 | -28.01% | 303 | 706 |
| 10/19/87 | 08/25/87 | 07/26/89 | 10/20/87 | -35.94% | 55 | 700 |
| 10/11/90 | 07/13/90 | 02/12/91 | 10/11/90 | -20.36% | 90 | 213 |
| 09/01/98 | 07/20/98 | 11/24/98 | 10/08/98 | -22.45% | 43 | 126 |
| 02/22/01 | 03/24/00 | 07/13/07 | 10/10/02 | -50.50% | 335 | 2666 |
| 07/01/08 | 10/11/07 | 04/10/13 | 03/06/09 | -57.69% | 264 | 2007 |
| 12/24/18 | 09/21/18 | ?? | ?? | -20.06% | 94 | ?? |
Average and Median Bear Market Performance in the S&P 500
Defining one bear market as a drawdown of 20% from the all time high until the next price high in the S&P 500, there have been 12 bear markets since January 1950. Counting the 20% threshold being crossed to attaining a new high, we've spent 37.98% of the time in bear markets.
| Summary Statistic | Max Drawdown | Peak Until Bear | Calendar Days Between Peaks |
| Average | -33.06% | 228.0 | 1016.6 |
| Median | -28.66% | 232.5 | 703.0 |
Comparing Our Current Bear Market in the S&P 500
We're currently in a bear market in S&P 500, the most watched broad market index in the United States. As it turns out, we actually spend more than a third of our time coming back from a bear market. Bear markets are a very common occurrence, and even though they are scary it's best to keep your wits about you in the current conditions.
We're not saying you can directly compare market conditions, but if you were to use "speed to bear market" as a signal of how this bear might play out, you'd be looking at three or four past bear markets. The October 1990, May 1962, and October 1987 (and possibly September 1998) bears are closest in swiftness to our current bear.
If those bears are anything like the current, you're looking at between 126 and 700 days until the next nominal all time high in the S&P 500. Those drawdowns varied between a mild -20.36% and a scarier -35.94%.
History doesn't repeat itself... but it often rhymes. How do you think the current December 2018 S&P 500 Bear will compare to past bears when all is said and done?
