
To see 2016 data, click here.
In this article, a continuation of our American Net Worth series, we explore the net worth it took to be in the 10%, 25%, 50%, 75%, 90%, and 99% (the 'one percent') bracket in 2013 for American Households headed by 18-24 year olds, 25-29 year olds, 30-34 year olds, 35-39 year olds, 40-44 year olds, 45-49 year olds, 50-54 year olds and finally 55 and older. So read on, and enjoy our research on the net worth of age groups in America!
This data comes from Federal Reserve Survey of Consumer Finance microdata, and our methodology is discussed in our first piece in the series which covers how income doesn't predict net worth all that well.
The Net Worth of Age Groups in America in 2013
In our last piece, we touched on the net worths of the 65+ (generally, retirees) households in the United States. We made a remark that the 65+ household demographic has the highest net worths - and this article fills in the details. First, a table, because we know some of you would like to copy & paste this data - and really, the chart's a bit stuffy (but colorful!). The top row is the 'net worth bracket', and if you trace the age group across you'll see the 'minimum amount' to be in that bracket. Age refers to the age of the 'primary earner', or whomever the household listed as the primary for retired households.
| Age | 10% | 25% | 50% | 75% | 90% | 99% |
| 18-24 | -$20,900.00 | -$2,860.00 | $4,400.00 | $15,600.00 | $45,521.00 | $388,350.00 |
| 25-29 | -$22,900.00 | -$1,100.00 | $9,460.00 | $42,000.00 | $127,580.00 | $594,400.00 |
| 30-34 | -$16,500.00 | $1,600.00 | $19,400.00 | $90,400.00 | $242,450.00 | $1,373,300.00 |
| 35-39 | -$6,100.00 | $4,300.00 | $36,320.00 | $185,806.00 | $496,000.00 | $2,814,200.00 |
| 40-44 | -$6,140.00 | $8,330.00 | $62,200.00 | $251,150.00 | $761,400.00 | $7,282,400.00 |
| 45-49 | -$2,500.00 | $11,060.00 | $72,070.00 | $305,400.00 | $831,780.00 | $5,216,000.00 |
| 50-54 | $0.00 | $14,200.00 | $122,100.00 | $440,400.00 | $1,017,000.00 | $7,222,100.00 |
| 55+ | $2,600.00 | $44,300.00 | $194,700.00 | $548,910.00 | $1,485,000.00 | $10,814,000.00 |
And now that stuffy chart I alluded to above:
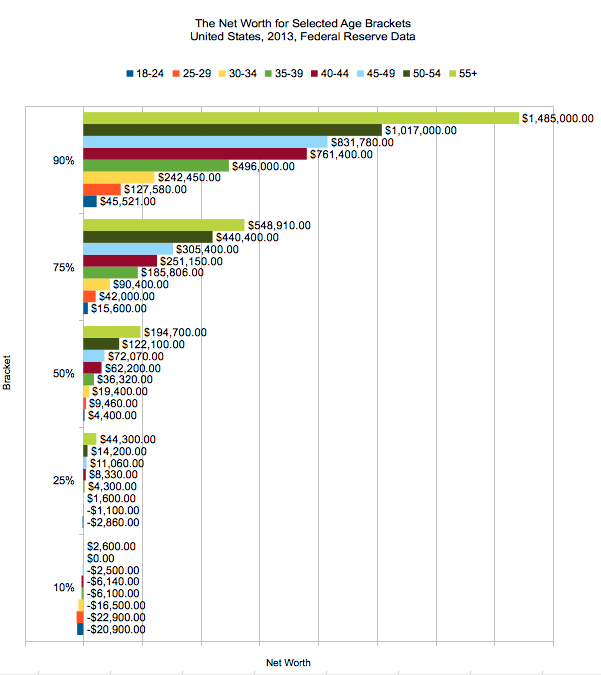
Net Worth of Age Groups: Age of Household and Net Worth by Bracket, 2013, United States
I know we're right up against the limits of respectable presentation without me figuring out how to turn it into an infographic. That's okay - my talent lies elsewhere, so stay tuned for an even deeper dive into the data.
At this juncture though, we're interested in your thoughts on the net worth of age groups in America - how do these net worth numbers line up with your expectations? Where do you fall in your bracket?
