
We present a income percentile by sex calculator for male income percentile and female income percentile in 2018 in the United States . Enter sex and pre-tax income earned between January and December 2017 to compare.
Also: see our individual income by age calculator, overall income percentile calculator, and household income calculator. We also have a net worth calculator and net worth by age calculator.
Income is from all sources. See here for a full accounting.
Income Percentile by Sex Calculator: Selected 2018 Statistics
For the following common income statistics questions, we divided results for males and females. Also, see the calculations below on the male-female income gap.
What was the Median Individual Income in 2018 for Women and Men?
For the full-year of earnings in 2017, median income for women was $33,280.00. Median income for men was $46,080.00.
What was the Average Male Income and Average Female Income in 2018?
For men, the average individual pre-tax income was $66,827.50 in full year 2017. For women, the average was $45,813.35.
How Many Males and Females Made 6 Figures?
By percentage of the workforce, 21.71% of all males and 9.04% of all females made a 6 figure income.
That's somewhere around 16,440,922 males and 6,844,469 females who earned $100,000 or more for the full year.
How Many Men and Women Made $250,000 or More?
Roughly 0.96% of female workers and 2.78% of male workers made $250,000 or more in full year 2017.
Numerically, approximately 725,564 women and 2,101,677 men made a quarter of a million dollars.
What Were the Cutoffs for the Top 10%, Top 5%, and Top 1% of Male and Female Incomes?
In full-year 2017 the cutoffs for the top percentiles were as follows:
| Sex | Male | Female |
| Top 10% | $135,300.00 | $90,742.00 |
| Top 5% | $180,840.00 | $122,367.00 |
| Top 1% | $370,916.00 | $234,910.00 |
The Income Gap Between Men and Women in 2018
In full year 2017, the median male worker made $12,800 more than the median female worker (+38.4%). The average working man made $21,014.15 more than the average working woman (+45.9%).
Stated as a wage gap, the median working woman made 72.2 cents on the dollar of the median working man in the United States.
Note that a full study of the income or wage gap requires controlling for some variables.
Importantly, controlling for career choice, weekly hours worked, and gaps in work history reduce the income gap between men and women. It does not eliminate the gap entirely, however – even accounting for those confounders there is a 3% to 8% unexplained gap between men's and women's earnings in the United States.
See here, here, and here for studies addressing the wage gap.
How Often Did Females and Males Work Full-time?
Traditionally, full time work is defined as 40 or more hours in a typical week... but there is no law mandating 40 hours. The Patient Protection and Affordable Care Act (popularly known as Obamacare) defined full-time work as 30 hours a week or 130 hours montly. Let's look at both 30 and 40 hour weekly breakpoints.
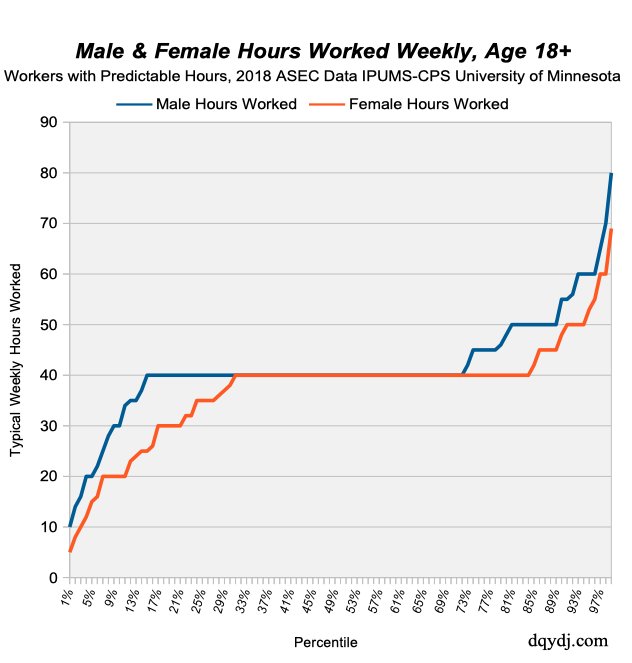
In 2017, of female workers with predictable weekly workloads, 83.2% worked 30 hours or more and 69.2% worked 40 hours or more. For males, 92.0% worked 30 or more hours and 85.1% worked 40 or more hours a week.
Graphically, here's the number of hours worked by percentile. This graph's population included only workers with predictable weekly schedules.
Source and Methodology on the 2018 Income Percentile by Sex Calculator
Sarah Flood, Miriam King, Renae Rodgers, Steven Ruggles, and J. Robert Warren. Integrated Public Use Microdata Series, Current Population Survey: Version 6.0 [dataset]. Minneapolis, MN: IPUMS, 2018. https://doi.org/10.18128/D030.V6.0
Data all comes from IPUMS-CPS from the University of Minnesota. The sample is from the Census Bureau's March 2018 ASEC supplement.
For methodology on defining the workforce, see the 2018 individual income bracket post. For the hours worked graph, we only used workers with predictable weekly hours.
