
Below is an individual income percentile by city calculator and a household income percentile by city calculator for 2018 in the United States. Enter a pre-tax household or individual income earned between January and December 2017 to compare with any metro area in the United States.
Need aggregated data? Try the income percentile by state calculator. Alternatively, try the individual income percentile calculator or household income percentile calculator.
Please read the discussion below on data quality and sample size.
Using the Income Percentile by City Calculator
The income percentile by city has a few quirks you need to account for while looking at city income distributions.
- First, specify individual income or income earned by a household.
- Second, pick the closest city or metro area to the city you're interested in (it may be easier to search on state abbreviation) and optional comparison metro areas.
- Third, account for any data limitations imposed on lower-population metropolitan areas.
Income Percentile by City Tool Input Options
Here's how to use the calculator:
- Income: Total pre-tax income earned either by one individual or a household. Total means any W-2 job income, along with business income, realized investment income, and any other sources from this list.
- Individual or Household: Choose whether you want to compare an individual's income or total income earned in a household.
- City: The primary city for the comparison. In the output, this is the city where we will show you the estimated income percentile. (Note that you can search for metro areas and it will automatically filter).
- Compare Cities: The secondary cities to add to the comparison; any city in this list will appear in the income by city visualization in the output. You can type in the box and the tool will auto-filter entries (again, using state abbreviation might help).
Warning: Any city marked with ˟ doesn't have sufficient data for a full income centile estimation. If you add one of these metros as ar primary or secondary city you'll only receive decile results (every 10%).
Income Percentile by City Tool Output
There are two primary outputs from the usage of the tool, a visualization of income distributions in your selected city and an estimated income percentile. The estimated percentile will use your choice of individual or household income by city.
Income Percentile by City Estimation
If you choose a primary city, income, and income type, DQYDJ will estimate the exact percentile for that total pre-tax income. For cities with sufficient data, that will be to the nearest 1%, although sparse data means some cities will only be to the closest 10%.
Example:

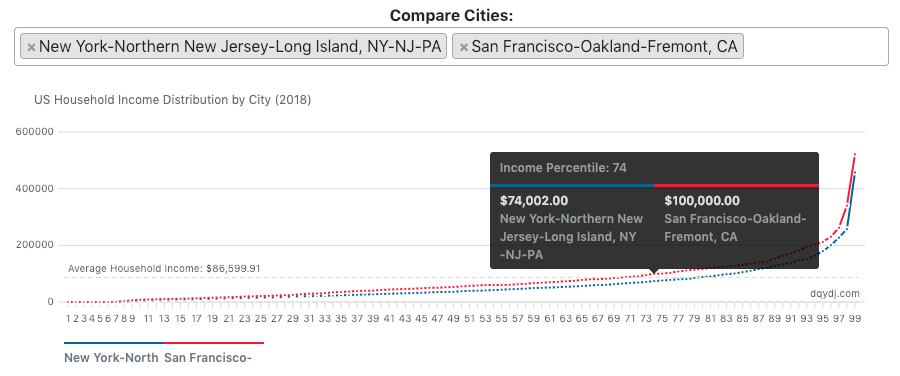
Income Percentile by City Visualization
When you first enter the page, edit the comparison cities, or run a new percentile estimation we'll give you an income distribution graph. The income distribution will show percentiles from 1% - 99% in income or deciles from 10% - 90% if a low-data metro is included.
If you run an estimation for your primary city, we'll also automatically place a marker on the graph. Note you can also hover to get exact data at any percentile or decile.
Example:
Individual Income Percentile by City Statistics
Using the underlying data inside the calculator, here are tables with the summary statistics for individual income by city. We have average income by city, median income by city, population, number of workers, and some selected income brackets.
Also, see the computed weighted standard error and number of samples that went into the estimate. See the methodology for details on data quality.
Household Income Percentile by City Statistics
Likewise, here are the summary statistics for household income by city. We have average income, median income, and some selected income brackets. We also have (a repeat) population, number of households, and some data quality information (see methodology).
Source and Methodology on the 2018 Income Percentile by City Calculator
Our source for the income percentile by city calculator was IPUMS-CPS:
Sarah Flood, Miriam King, Renae Rodgers, Steven Ruggles, and J. Robert Warren. Integrated Public Use Microdata Series, Current Population Survey: Version 6.0 [dataset]. Minneapolis, MN: IPUMS, 2018. https://doi.org/10.18128/D030.V6.0
See the individual income bracket article for details on the filter for workers. There is no corresponding filter for households, all households per city make the screen for that selection.
- A city in our income definition is a metropolitan area defined by IPUMS.
- Income is all sources of income, not only salary or wages. This includes business income, investment income, and all sources listed here.
- Weighted mean standard error is defined as the weighted mean of samples from a metro area divided by the number of unweighted samples from that metro in the public dataset. This methodology matches Berkeley SDA's. You can see the raw number of data points or samples for each city in the data tables.To be absolutely clear: weighted mean standard error's an approximation. Not only is the measure controversial, but the Census Bureau makes those exact numbers impossible to calculate due to anonymization methods such as topcoding. We include standard errors due to popular demand - not because we are fans.Regardless, low sample sizes and large standard errors mean you need to be skeptical of the data for smaller cities. E.g.: we doubt it's more lucrative to live in Barnstable, MA than in San Jose, CA. Cape Cod (Barnstable counts, it's past the bridge!) is an great place but can't compete with the salaries in Silicon Valley.
In the calculator and tables data for some city income percentiles are 'missing'. In the tables, we required a minimum of 250 households and 300 individuals to show centiles. In the calculator, we added centiles for cities which met either criteria. The calculator should automatically adjust to deciles if you add a metro area with fewer data points.
Finally, we'd be remiss if we didn't include the metro area warning directly from the census bureau:
"One set of estimates that can be produced from CPS microdata files should be treated with caution. These are estimates for individual metropolitan areas. Although estimates for the larger areas such as New York, Los Angeles, and so forth, should be fairly accurate and valid for a multitude of uses, estimates for the smaller metropolitan areas (those with populations under 500,000) should be used with caution because of the relatively large sampling variability associated with these estimates."
We've included population in both household and individual income by city tables for you to take a look.
