
The S&P 500 and the broader equity markets continue to outperform and have seen annual inflation-adjusted 15.8% returns from March 2009 through the end of December 2017. More recently, from November 2016 to January 2017, the S&P 500 has returned 22.3% in total.
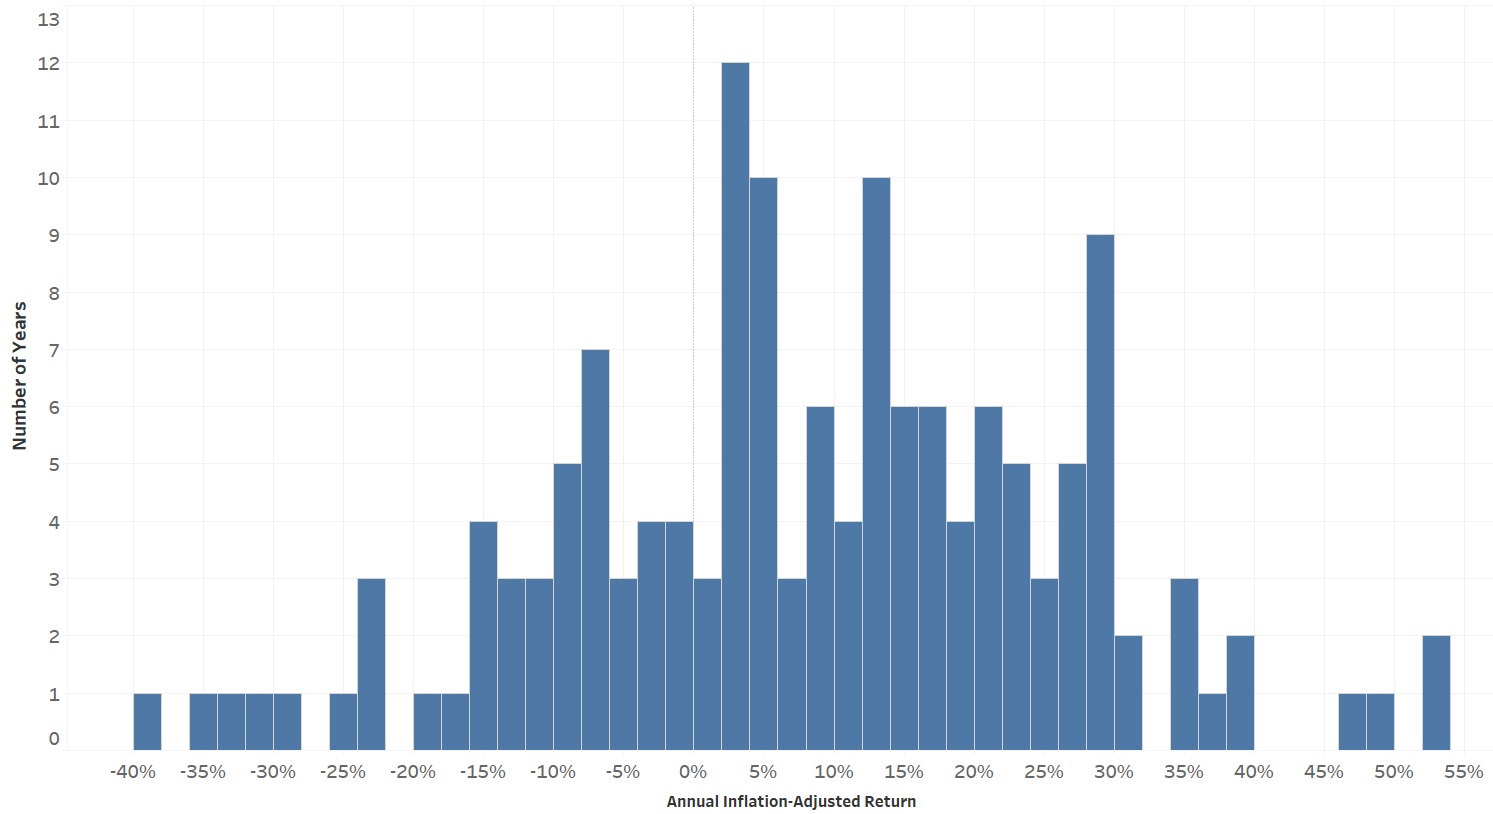
Annual S&P 500 Returns Vary Wildly
I started with each year's inflation adjusted S&P 500 return, inflation-adjusted from data by Robert Shiller dating back to 1871. DQYDJ has a S&P 500 return calculator here.
The returns are vastly different, even if returns will average out to 6%-10% per year. This variance is why sequence risk is a major threat to early retirement, where a few very negative years hit a retiree in early retirement years even if they would be safe from later declines.
Another consequence of this is that very rarely will the stock market return "around" any number. Thus, when a market predictor says "the market will return 3% next year", it is very unlikely that it will return exactly 3%. The "prediction" (if it is worth anything) is best thought of as "the least wrong" estimate.
How Good Has 2018 Been for the S&P 500 So Far?
Monthly data would show an even wider variance, even if the absolute numbers of the returns are lower (sadly no month ever returned 40%).
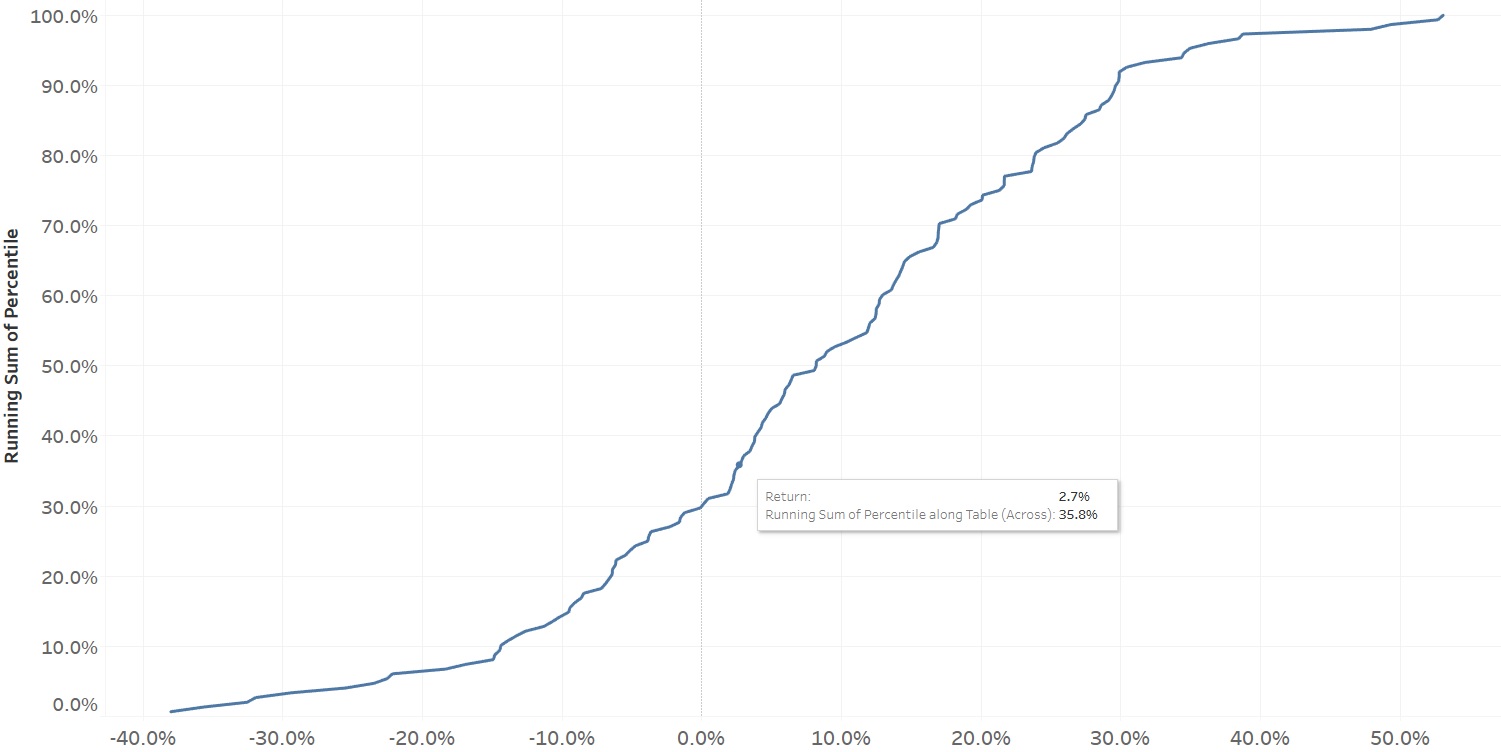
As of this writing, the S&P 500 has returned 2.72% in 2018, putting it right at the 36th percentile for annual returns. Most years it's beating are negative years (as can be seen on the chart). Given we are only 8 trading days into the year out of ~252, we are on pace for a 132.9% return this year. (You can count on that!)
Some fun S&P 500 return facts:
- The best year since 1959 was 1995 at a 31.7% return followed by 2009 at a 29.9% return
- The worst year on record is 1931, when the S&P (it wasn't yet the '500') declined 38.0% in a year. Only shortly behind, however, was 2008 which dropped 35.7%.
- The 25th percentile, median and 75th percentile are -3.86%, 8.20% and 21.31%
How Should S&P 500 Returns Be Projected?
Returns are notoriously difficult to project. People have been calling market ceilings forever, starting heavily during 2011 in the current market cycle.
The problem with many of these predictions are the timing and the confidence of the claim. Certainly, a case can be made for stocks being overpriced but it is important to mind the difficulty in predicting the exact timing of a potential turn and the magnitude of the turn.
When projecting future returns for your portfolio, it is most appropriate to use a wide distribution of returns. You may have a strong belief about a mean return estimate (say, 7% a year over a series of years), but it is helpful to show how sensitive portfolios are to either different mean estimates (say, if the return drops to 4% on average) or to a series of very bad years.
This can be modeled using some of the traditional returns. For example, look at the chart up above, where 25% of annual returns were above 21.3% and another 25% were above 8.2%.
In short, doubt the certainty of any prediction within a tight timeframe. You can play around with annual returns in any 12 month rolling period with our S&P 500 Historical Return Calculator.
Cheers,
Cameron Daniels
