
The average American household carried a $2,846.81 credit card balance in 2019. That debt was concentrated in only a few households, however – the median household carried no balance cycle to cycle, while the top 10% of households had $8,500 in credit card debt.
54.6% of households held no credit card debt balance from month to month.
In this post, I'll talk about credit card debt in America. Downpage, the breakdowns are mostly pre-COVID-19 data (9% of surveys were during the early pandemic in America). The top aggregated section includes more recent stats.
Credit Card Debt Statistics in America
Americans spend a lot on their credit cards. The New York Federal Reserve reports on the makeup of household debts and assets every quarter – unfortunately, only in large aggregate groups.
In the most recent refresh, households carried $810 billion in credit card debt as a group. Further, 9.7% of that debt was 90 or more days delinquent – that's on top of a standard monthly credit card cycle.
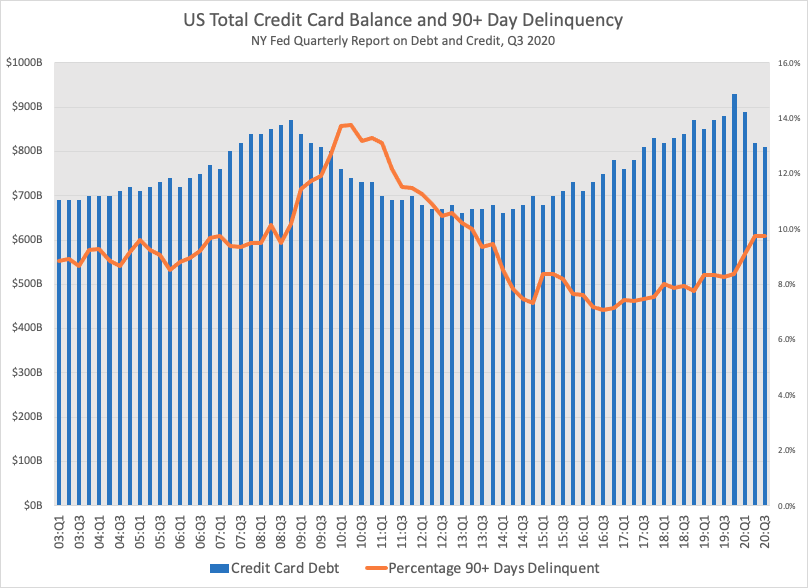
Your eyes don't deceive you. The absolute balance of credit card debt is down through the pandemic – undoubtedly assisted by the generous unemployment insurance and stimulus programs. However, disconcertingly, the percentage of the remaining balance 90 days delinquent (or longer) has ticked up to 9.7%.
We came close to those stats in Q4 or 2006 and Q1 of 2007 – and the 90+ day delinquency rate kept rising to 13.7% in Q2 2010. The total credit card balance was $760 billion in Q4 2007, falling to $740 billion by Q2 2010.
What does that mean? I'm not sure.
Americans have certainly paid off newer balances, leaving a higher proportion of delinquent balances. But as for how to interpret that data amid stimulus – or to forecast the effects – let me know your guess.
Credit Card Debt Statistics by Percentile
As I mentioned above, not every household carries a credit card balance from month to month a slight majority of households do not. Here's how credit card debt broke down by percentile in 2019:
| Household Credit Card Debt Percentile | Credit Card Debt |
| 10% | 0 |
| 20% | 0 |
| 30% | 0 |
| 40% | 0 |
| 50% | 0 |
| 60% | $300 |
| 70% | $1,230 |
| 80% | $3,400 |
| 90% | $8,500 |
The number listed is the minimum breakpoint which puts a household in a bracket to read this chart. For example, a household with $5,000 in credit card debt would be between the 80th and 90th credit card debt deciles. That's the top 20% most (credit card) indebted households.
Credit Card Debt by Generation
Generations use their credit cards differently… and credit habits evolve as you age. Here's a more interesting breakdown that groups people into their generation – Millennials to the Greatest Generation.
We'll have to wait on the next SCF (late 2022) for younger folks, but here's the 2019 breakdown:
| Generation | Average | 25th Percentile | Median | 75th Percentile | Percentage with CC Debt |
| Millennial | $2,088.25 | $0.00 | $0.00 | $1,900.00 | 48.17% |
| Generation X | $3,503.57 | $0.00 | $100.00 | $3,100.00 | 51.18% |
| Baby Boomer | $3,066.98 | $0.00 | $0.00 | $2,000.00 | 44.15% |
| Silent | $2,279.03 | $0.00 | $0.00 | $250.00 | 28.10% |
| Greatest | $1,251.50 | $0.00 | $0.00 | $0.00 | 17.08% |
And here's the division of generations:
- Millennial (18-37 years old)
- Gen X (38-54)
- Baby Boomer (55-74)
- Silent (75-94)
- Greatest (95+) *
*Note: there are only 45 samples (9 'real' surveys) of Greatest Generation households in the dataset.
Credit Card Debt by Income Bracket
Also always interesting: debt by income bracket. Just as peoples' risk tolerance changes by age and situation, different income brackets show different credit card habits.
This table summarizes various income percentiles and shows the median, 25th, and 75th percentile of credit card debt (and the average) for US households in 2019:
| Income Bracket | 25% | 50% | 75% | Average |
| 0-9.9 | $0.00 | $0.00 | $0.00 | $1,002.14 |
| 10-19.9 | $0.00 | $0.00 | $650.00 | $1,331.78 |
| 20-29.9 | $0.00 | $0.00 | $1,200.00 | $1,640.35 |
| 30-39.9 | $0.00 | $0.00 | $2,000.00 | $2,601.96 |
| 40-49.9 | $0.00 | $40.00 | $2,000.00 | $2,266.55 |
| 50-59.9 | $0.00 | $400.00 | $3,400.00 | $3,139.38 |
| 60-69.9 | $0.00 | $200.00 | $3,050.00 | $3,354.74 |
| 70-79.9 | $0.00 | $700.00 | $5,500.00 | $4,588.20 |
| 80-89.9 | $0.00 | $0.00 | $4,000.00 | $4,482.04 |
| 90-94.9 | $0.00 | $0.00 | $3,600.00 | $4,682.32 |
| 95-98.9 | $0.00 | $0.00 | $600.00 | $3,964.08 |
| 99-100 | $0.00 | $0.00 | $0.00 | $1,326.06 |
Credit Card Debt in America Methodology
This posts' stats – unless otherwise credited – are sourced from the Federal Reserve SCF's 2019 survey.
One picky note: technically we're looking at PEUs or Primary Economic Units, not households:
"...the PEU consists of an economically dominant single individual or couple (married or living as partners) in a household and all other individuals in the household who are financially interdependent with that individual or couple.
For example, in the case of a household composed of a married couple who own their home, a minor child, a dependent adult child, and a financially independent parent of one of the members of the couple, the PEU would be the couple and the two children."
Federal Reserve SCF Data Codebook, 2019
