
In this post I estimate United States Individual Income Brackets by Age for 2019. I then calculate average income by age, plus median and top 1% by age in the United States.
Individual incomes here are limited to Americans who worked (or wanted to work) in 2018. Incomes were earned between January and December 2018. "Income" is pre-tax income from all sources, including salary - see the methodology section.
We also have research on household incomes and individual incomes.
Individual Income Benchmarks by Age in 2019
Using age in income comparisons is very useful. Age is an excellent proxy for experience – not always, but generally older folks will have more experience in a given field.
More experience also usually means more skill and a higher income. When looking at income it's best to benchmark your earnings versus your peers instead of folks with more or less experience.
Just like with other income breakdowns (such as individual income or household income), the most important summary statistics for income by age are:
- Median income
- Average income
- Top 1% income
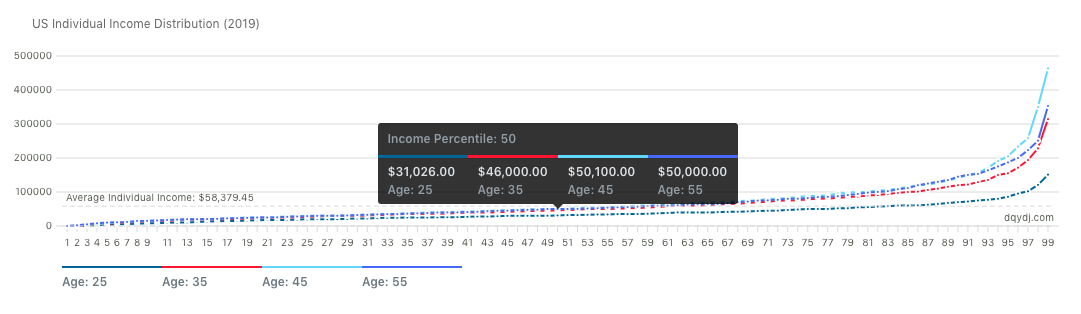
What is the median individual income by age in the United States?
These are the median incomes by age for 2019 in the United States for some selected ages:
- Age 25: $31,026
- Age 35: $46,000
- Age 45: $50,100
- Age 55: $50,000
- Age 65: $49,009
This table has every age (18-80) plus its median income in 2019 in the United States:
| Age | 2019 Median Income |
| 18 | $5,000.00 |
| 19 | $10,000.00 |
| 20 | $14,438.00 |
| 21 | $18,000.00 |
| 22 | $18,501.00 |
| 23 | $23,000.00 |
| 24 | $27,000.00 |
| 25 | $31,026.00 |
| 26 | $34,000.00 |
| 27 | $33,003.00 |
| 28 | $36,000.00 |
| 29 | $40,000.00 |
| 30 | $40,000.00 |
| 31 | $42,000.00 |
| 32 | $42,000.00 |
| 33 | $41,800.00 |
| 34 | $42,202.00 |
| 35 | $46,000.00 |
| 36 | $46,805.00 |
| 37 | $47,581.00 |
| 38 | $49,502.00 |
| 39 | $50,000.00 |
| 40 | $47,529.00 |
| 41 | $50,000.00 |
| 42 | $50,000.00 |
| 43 | $50,000.00 |
| 44 | $50,012.00 |
| 45 | $50,100.00 |
| 46 | $50,001.00 |
| 47 | $50,000.00 |
| 48 | $50,262.00 |
| 49 | $50,031.00 |
| 50 | $50,210.00 |
| 51 | $50,005.00 |
| 52 | $50,780.00 |
| 53 | $50,300.00 |
| 54 | $51,571.00 |
| 55 | $50,000.00 |
| 56 | $50,325.00 |
| 57 | $50,050.00 |
| 58 | $50,010.00 |
| 59 | $50,001.00 |
| 60 | $50,000.00 |
| 61 | $48,025.00 |
| 62 | $50,000.00 |
| 63 | $49,002.00 |
| 64 | $50,282.00 |
| 65 | $49,009.00 |
| 66 | $50,000.00 |
| 67 | $50,201.00 |
| 68 | $50,000.00 |
| 69 | $48,100.00 |
| 70 | $53,260.00 |
| 71 | $50,962.00 |
| 72 | $50,312.00 |
| 73 | $49,711.00 |
| 74 | $46,709.00 |
| 75 | $47,726.00 |
| 76 | $49,147.00 |
| 77 | $40,800.00 |
| 78 | $38,460.00 |
| 79 | $39,914.00 |
| 80 | $47,170.00 |
What is the average income by age in the United States?
Here are the 2019 average incomes by age for age 25 and ten year intervals:
- Age 25: $38,777.43
- Age 35: $63,208.57
- Age 45: $74,123.42
- Age 55: $69,780.96
- Age 65: $67,327.07
This table has every age (18-80) plus their average income in 2019 in the United States:
| Age | Average Income in 2019 |
| 18 | $8,419.92 |
| 19 | $13,484.63 |
| 20 | $17,456.99 |
| 21 | $21,927.80 |
| 22 | $23,680.10 |
| 23 | $28,823.74 |
| 24 | $32,411.95 |
| 25 | $38,777.43 |
| 26 | $43,940.47 |
| 27 | $41,844.25 |
| 28 | $43,839.07 |
| 29 | $49,648.75 |
| 30 | $48,241.83 |
| 31 | $52,198.99 |
| 32 | $55,369.57 |
| 33 | $56,303.55 |
| 34 | $55,846.51 |
| 35 | $63,208.57 |
| 36 | $62,349.18 |
| 37 | $62,651.61 |
| 38 | $65,927.26 |
| 39 | $65,655.99 |
| 40 | $67,409.78 |
| 41 | $64,725.98 |
| 42 | $69,979.17 |
| 43 | $66,558.13 |
| 44 | $68,586.57 |
| 45 | $74,123.42 |
| 46 | $68,458.79 |
| 47 | $69,976.13 |
| 48 | $68,355.00 |
| 49 | $68,722.18 |
| 50 | $76,824.21 |
| 51 | $71,747.16 |
| 52 | $69,358.36 |
| 53 | $76,667.95 |
| 54 | $74,347.09 |
| 55 | $69,780.96 |
| 56 | $70,762.18 |
| 57 | $77,965.45 |
| 58 | $72,677.86 |
| 59 | $70,758.67 |
| 60 | $74,781.76 |
| 61 | $68,990.69 |
| 62 | $70,455.68 |
| 63 | $67,963.07 |
| 64 | $70,202.60 |
| 65 | $67,327.07 |
| 66 | $70,053.91 |
| 67 | $72,848.08 |
| 68 | $78,342.62 |
| 69 | $72,454.02 |
| 70 | $83,501.94 |
| 71 | $72,900.43 |
| 72 | $80,289.49 |
| 73 | $78,893.76 |
| 74 | $73,914.76 |
| 75 | $83,296.55 |
| 76 | $68,950.29 |
| 77 | $57,016.60 |
| 78 | $69,880.52 |
| 79 | $56,169.67 |
| 80 | $62,235.20 |
What is the top 1% individual income by age in the United States?
As a summary, here is the 2019 top 1% income by age for age 25 and ten year intervals:
- Age 25: $151,101
- Age 35: $314,140
- Age 45: $463,560
- Age 55: $353,004
- Age 65: $391,000
Treat this data with more skepticism than median or average incomes. By definition, there are fewer earners up here plus their income sources are more volatile than the fat part of the income curve.
(If you don't believe me look at age 50, 68, and 70!)
Notably, income models are well-behaved until around the 96th-98th percentile, but the top 1% are outliers. Look at a couple adjacent ages for a good feel of what the "actual" 1% might be.
Here's the table for the top 1% income threshold for every age in the United States in 2019:
| Age | Top 1% Income 2019 |
| 18 | $53,006.00 |
| 19 | $68,000.00 |
| 20 | $75,001.00 |
| 21 | $100,000.00 |
| 22 | $110,000.00 |
| 23 | $112,512.00 |
| 24 | $133,081.00 |
| 25 | $151,101.00 |
| 26 | $210,005.00 |
| 27 | $172,000.00 |
| 28 | $175,007.00 |
| 29 | $200,000.00 |
| 30 | $210,005.00 |
| 31 | $210,241.00 |
| 32 | $256,200.00 |
| 33 | $278,604.00 |
| 34 | $250,125.00 |
| 35 | $314,140.00 |
| 36 | $328,985.00 |
| 37 | $330,451.00 |
| 38 | $344,055.00 |
| 39 | $300,401.00 |
| 40 | $409,164.00 |
| 41 | $330,132.00 |
| 42 | $409,164.00 |
| 43 | $345,081.00 |
| 44 | $320,002.00 |
| 45 | $463,560.00 |
| 46 | $340,127.00 |
| 47 | $360,305.00 |
| 48 | $343,299.00 |
| 49 | $384,700.00 |
| 50 | $650,001.00 |
| 51 | $361,850.00 |
| 52 | $386,969.00 |
| 53 | $490,330.00 |
| 54 | $473,100.00 |
| 55 | $353,004.00 |
| 56 | $425,171.00 |
| 57 | $571,010.00 |
| 58 | $374,619.00 |
| 59 | $335,226.00 |
| 60 | $480,600.00 |
| 61 | $316,852.00 |
| 62 | $405,137.00 |
| 63 | $340,411.00 |
| 64 | $353,485.00 |
| 65 | $391,000.00 |
| 66 | $339,280.00 |
| 67 | $377,281.00 |
| 68 | $717,400.00 |
| 69 | $371,250.00 |
| 70 | $729,000.00 |
| 71 | $413,489.00 |
| 72 | $595,091.00 |
| 73 | $423,119.00 |
| 74 | $450,435.00 |
| 75 | $535,083.00 |
| 76 | $394,147.00 |
| 77 | $320,000.00 |
| 78 | $411,400.00 |
| 79 | $221,335.00 |
| 80 | $242,390.00 |
| 85 | $410,860.00 |
United States Individual Income Percentiles by Age
Again, age is a very useful proxy for experience. By dividing income distributions in the United States into ages, you get a better glimpse at how an income stacks up versus peers.
It's important to understand what I mean by income here. Income is all income earned by one individual. Think:
- Wage income or earnings
- Business income
- Investment income
- Interest
- Other income: see the list of all components
Income by Age Summary for the United States in 2019
This table summarizes the income by age distribution for the United States in 2019. (Scroll up to see top 1% income by age and average income by age.)
Along the top is the income percentile break-point. There is one row per age. When I say 'income break-point' I mean the income which divides two income percentiles. Stated another way: an 18 year old who made $10,500 is in the 75th percentile.
| Age | 10% | 25% | 50% | 75% | 90% | 95% |
| 18 | $0.00 | $1,600.00 | $5,000.00 | $10,500.00 | $20,501.00 | $28,392.00 |
| 19 | $0.00 | $3,013.00 | $10,000.00 | $18,584.00 | $29,000.00 | $38,000.00 |
| 20 | $1,626.00 | $6,005.00 | $14,438.00 | $24,005.00 | $35,000.00 | $44,000.00 |
| 21 | $3,000.00 | $9,000.00 | $18,000.00 | $29,000.00 | $40,505.00 | $52,010.00 |
| 22 | $2,000.00 | $8,200.00 | $18,501.00 | $30,000.00 | $45,005.00 | $55,000.00 |
| 23 | $3,900.00 | $12,000.00 | $23,000.00 | $35,001.00 | $51,010.00 | $65,001.00 |
| 24 | $5,000.00 | $15,205.00 | $27,000.00 | $40,170.00 | $60,000.00 | $75,001.00 |
| 25 | $8,200.00 | $19,500.00 | $31,026.00 | $50,000.00 | $70,110.00 | $85,950.00 |
| 26 | $9,200.00 | $20,100.00 | $34,000.00 | $53,000.00 | $76,801.00 | $100,000.00 |
| 27 | $10,000.00 | $21,000.00 | $33,003.00 | $52,000.00 | $74,800.00 | $95,910.00 |
| 28 | $10,000.00 | $22,001.00 | $36,000.00 | $56,345.00 | $80,190.00 | $100,000.00 |
| 29 | $10,560.00 | $25,000.00 | $40,000.00 | $61,000.00 | $93,367.00 | $121,500.00 |
| 30 | $11,000.00 | $24,000.00 | $40,000.00 | $60,101.00 | $90,030.00 | $112,016.00 |
| 31 | $12,000.00 | $25,000.00 | $42,000.00 | $65,125.00 | $98,150.00 | $120,000.00 |
| 32 | $12,100.00 | $25,331.00 | $42,000.00 | $67,502.00 | $106,750.00 | $133,021.00 |
| 33 | $12,000.00 | $25,000.00 | $41,800.00 | $68,000.00 | $105,000.00 | $136,928.00 |
| 34 | $12,000.00 | $25,000.00 | $42,202.00 | $69,000.00 | $102,523.00 | $133,324.00 |
| 35 | $15,000.00 | $27,002.00 | $46,000.00 | $79,000.00 | $120,000.00 | $155,017.00 |
| 36 | $14,000.00 | $26,010.00 | $46,805.00 | $77,001.00 | $120,040.00 | $165,330.00 |
| 37 | $14,461.00 | $28,000.00 | $47,581.00 | $76,001.00 | $112,115.00 | $150,503.00 |
| 38 | $14,000.00 | $28,000.00 | $49,502.00 | $80,055.00 | $127,565.00 | $169,600.00 |
| 39 | $14,504.00 | $27,005.00 | $50,000.00 | $78,111.00 | $122,773.00 | $160,794.00 |
| 40 | $14,400.00 | $27,509.00 | $47,529.00 | $80,400.00 | $126,384.00 | $170,102.00 |
| 41 | $15,000.00 | $27,002.00 | $50,000.00 | $78,101.00 | $126,635.00 | $170,160.00 |
| 42 | $14,400.00 | $28,000.00 | $50,000.00 | $81,015.00 | $140,000.00 | $181,852.00 |
| 43 | $15,000.00 | $29,255.00 | $50,000.00 | $83,025.00 | $130,000.00 | $177,310.00 |
| 44 | $13,600.00 | $28,000.00 | $50,012.00 | $82,000.00 | $132,002.00 | $184,631.00 |
| 45 | $16,000.00 | $30,000.00 | $50,100.00 | $88,450.00 | $140,722.00 | $204,720.00 |
| 46 | $16,000.00 | $28,809.00 | $50,001.00 | $81,026.00 | $132,999.00 | $184,920.00 |
| 47 | $15,000.00 | $30,000.00 | $50,000.00 | $80,302.00 | $138,456.00 | $179,010.00 |
| 48 | $15,000.00 | $30,000.00 | $50,262.00 | $81,101.00 | $130,001.00 | $180,000.00 |
| 49 | $14,000.00 | $29,200.00 | $50,031.00 | $80,334.00 | $130,006.00 | $180,890.00 |
| 50 | $15,310.00 | $30,000.00 | $50,210.00 | $88,000.00 | $142,500.00 | $200,000.00 |
| 51 | $15,300.00 | $28,000.00 | $50,005.00 | $85,308.00 | $141,755.00 | $193,226.00 |
| 52 | $14,000.00 | $27,220.00 | $50,780.00 | $84,000.00 | $132,922.00 | $171,917.00 |
| 53 | $15,000.00 | $29,922.00 | $50,300.00 | $86,550.00 | $150,200.00 | $200,752.00 |
| 54 | $15,003.00 | $30,000.00 | $51,571.00 | $85,000.00 | $140,700.00 | $192,000.00 |
| 55 | $16,309.00 | $29,003.00 | $50,000.00 | $82,004.00 | $145,050.00 | $186,935.00 |
| 56 | $15,000.00 | $30,000.00 | $50,325.00 | $84,001.00 | $135,200.00 | $195,000.00 |
| 57 | $15,000.00 | $28,800.00 | $50,050.00 | $85,002.00 | $150,090.00 | $208,020.00 |
| 58 | $16,800.00 | $28,001.00 | $50,010.00 | $83,803.00 | $136,750.00 | $189,963.00 |
| 59 | $16,000.00 | $30,000.00 | $50,001.00 | $86,207.00 | $147,001.00 | $200,493.00 |
| 60 | $15,000.00 | $30,000.00 | $50,000.00 | $83,000.00 | $140,000.00 | $209,100.00 |
| 61 | $15,100.00 | $29,000.00 | $48,025.00 | $81,200.00 | $137,225.00 | $183,060.00 |
| 62 | $15,000.00 | $27,001.00 | $50,000.00 | $86,000.00 | $140,003.00 | $180,000.00 |
| 63 | $15,695.00 | $28,000.00 | $49,002.00 | $80,951.00 | $142,229.00 | $189,274.00 |
| 64 | $14,005.00 | $28,004.00 | $50,282.00 | $85,767.00 | $139,400.00 | $180,200.00 |
| 65 | $15,245.00 | $28,684.00 | $49,009.00 | $80,019.00 | $126,898.00 | $190,000.00 |
| 66 | $17,000.00 | $28,287.00 | $50,000.00 | $89,092.00 | $143,475.00 | $183,920.00 |
| 67 | $17,444.00 | $30,000.00 | $50,201.00 | $89,502.00 | $147,019.00 | $224,216.00 |
| 68 | $16,287.00 | $31,000.00 | $50,000.00 | $86,480.00 | $150,652.00 | $210,101.00 |
| 69 | $18,540.00 | $29,396.00 | $48,100.00 | $82,196.00 | $154,881.00 | $214,753.00 |
| 70 | $16,712.00 | $30,149.00 | $53,260.00 | $89,104.00 | $167,570.00 | $230,001.00 |
| 71 | $17,100.00 | $27,976.00 | $50,962.00 | $83,890.00 | $156,608.00 | $217,560.00 |
| 72 | $16,288.00 | $29,440.00 | $50,312.00 | $91,940.00 | $182,182.00 | $240,256.00 |
| 73 | $16,728.00 | $30,171.00 | $49,711.00 | $92,111.00 | $171,895.00 | $258,000.00 |
| 74 | $16,596.00 | $30,690.00 | $46,709.00 | $79,231.00 | $135,060.00 | $159,507.00 |
| 75 | $20,402.00 | $28,527.00 | $47,726.00 | $101,337.00 | $170,469.00 | $257,560.00 |
| 76 | $15,459.00 | $25,352.00 | $49,147.00 | $81,300.00 | $157,300.00 | $182,184.00 |
| 77 | $13,544.00 | $23,478.00 | $40,800.00 | $66,371.00 | $115,359.00 | $158,710.00 |
| 78 | $14,720.00 | $22,724.00 | $38,460.00 | $74,491.00 | $139,608.00 | $173,855.00 |
| 79 | $15,636.00 | $24,880.00 | $39,914.00 | $74,320.00 | $122,800.00 | $147,525.00 |
| 80 | $15,000.00 | $27,002.00 | $47,170.00 | $79,041.00 | $129,139.00 | $189,580.00 |
| 85 | $10,000.00 | $21,396.00 | $39,019.00 | $65,600.00 | $115,250.00 | $192,054.00 |
I'm not holding back on you on purpose - it's just hard to show many percentiles in a table. Use the income percentile by age calculator to see income by age distribution at the highest resolution.
Methodology on 2019 United States Household Income Brackets
This data comes from the United States Census Bureau's Annual ASEC survey. It was released in September 2019.
I then use harmonized data from the University of Minnesota's Minnesota Population Center in R. Citation:
Sarah Flood, Miriam King, Renae Rodgers, Steven Ruggles and J. Robert Warren. Integrated Public Use Microdata Series, Current Population Survey: Version 6.0 [dataset]. Minneapolis, MN: IPUMS, 2019. https://doi.org/10.18128/D030.V6.0
How can I cite your individual income by age data?
Go ahead and quote an excerpt and link back here.
Also include the IPUMS citation in the previous section.
What is your 'worker' screen?
See the individual income percentile research post for the screen. We cast a broad net, but this data is only people who were in the workforce at some point in 2018.
The only additional filter on top of that data is – of course – splitting the data by age.
How is the data quality on the income by age data?
I'm glad you asked. I want you to be skeptical of the top few percentiles for each age. Income is a relatively well-behaved distribution for the majority of the income curve. However, people at the top generate income from income sources with more volatility: think investments and businesses. We're starting from 181,000 data points or so; this data isn't as exhaustive as the 2020 census will be, for example.
To get a sense of the "actual top 1% income" for an age – if that's a measure that you really need – look up and down by a few years of age to get a feel.
Don't get me wrong: this data is excellent for business intelligence needs. Just be skeptical about the exact boundary between percentiles.
Income data points and workers by age in 2019
As for the actual number of data points per age, here's the exhaustive list for you to make a reasoned call. There are two numbers:
- The number of "data points", or the actual number of people in the survey
- The estimated number of workers by age that those data points represent (based on the survey weightings)
| Age | Respondents | 2019 Workers by Age (Est.) |
| 18 | 1,370 | 2,151,034 |
| 19 | 1,338 | 2,339,507 |
| 20 | 1,427 | 2,852,789 |
| 21 | 1,538 | 3,256,423 |
| 22 | 1,559 | 3,326,844 |
| 23 | 1,583 | 3,496,794 |
| 24 | 1,710 | 3,744,314 |
| 25 | 1,714 | 3,752,080 |
| 26 | 1,818 | 4,007,105 |
| 27 | 1,833 | 4,007,167 |
| 28 | 1,936 | 4,062,599 |
| 29 | 2,018 | 4,228,172 |
| 30 | 2,003 | 3,834,447 |
| 31 | 2,100 | 3,912,710 |
| 32 | 2,021 | 3,717,969 |
| 33 | 2,123 | 3,701,778 |
| 34 | 2,175 | 3,736,467 |
| 35 | 2,142 | 3,637,096 |
| 36 | 2,222 | 3,673,313 |
| 37 | 2,223 | 3,672,298 |
| 38 | 2,255 | 3,695,801 |
| 39 | 2,159 | 3,518,683 |
| 40 | 2,154 | 3,453,967 |
| 41 | 2,131 | 3,438,289 |
| 42 | 2,061 | 3,411,370 |
| 43 | 1,992 | 3,247,568 |
| 44 | 1,974 | 3,182,849 |
| 45 | 1,910 | 3,190,568 |
| 46 | 1,996 | 3,424,752 |
| 47 | 2,033 | 3,584,015 |
| 48 | 2,051 | 3,590,037 |
| 49 | 1,982 | 3,477,124 |
| 50 | 1,928 | 3,483,165 |
| 51 | 1,814 | 3,289,848 |
| 52 | 1,747 | 3,269,208 |
| 53 | 1,754 | 3,392,563 |
| 54 | 1,745 | 3,367,078 |
| 55 | 1,766 | 3,314,361 |
| 56 | 1,764 | 3,424,338 |
| 57 | 1,635 | 3,081,235 |
| 58 | 1,616 | 3,181,570 |
| 59 | 1,537 | 3,030,352 |
| 60 | 1,567 | 3,011,631 |
| 61 | 1,451 | 2,831,391 |
| 62 | 1,325 | 2,690,566 |
| 63 | 1,241 | 2,419,032 |
| 64 | 1,094 | 2,175,504 |
| 65 | 931 | 1,807,441 |
| 66 | 839 | 1,651,796 |
| 67 | 694 | 1,361,374 |
| 68 | 636 | 1,222,724 |
| 69 | 570 | 1,155,346 |
| 70 | 466 | 965,810 |
| 71 | 411 | 790,490 |
| 72 | 395 | 801,601 |
| 73 | 260 | 553,146 |
| 74 | 240 | 471,271 |
| 75 | 195 | 417,919 |
| 76 | 188 | 375,390 |
| 77 | 163 | 330,049 |
| 78 | 134 | 282,894 |
| 79 | 104 | 199,371 |
| 80 | 324 | 709,510 |
| 85 | 154 | 311,715 |
Is individual income gross or net?
All income by age numbers in this post are gross income, or before tax. If you are comparing an income make sure it is before any tax is taken out.
Analysis of Individual Income by Age Brackets in 2019
Every year this is one of my favorite posts to produce (along with the income by age calculator, of course!).
Dividing by actual earnings for individual earners and ages helps eliminate the effects of shifting demographics. Looking at household income, for example, is misleading if there are more earners per household than in another year, country, or even state. (See the Simpson's Paradox).
As for conclusions, looking at income by age is also suggestive of career income curves. While not a perfect match, near age 40 on up incomes start to look alike in the middle of the distribution. This suggests that earnings typically grow until ~ 38-42 before leveling off. (Again, I know, beware the distribution - but in aggregate this is true. Other data suggests the same.)
While that phenomenon isn't true for everyone (especially the top of the curve), it's useful directional information when looking at spending. To boil it down: a 30 year old and a 50 year old should approach spending plans and assumed income increases differently.
See anything interesting in the data?
