
Below is an individual income percentile by city calculator and a household income percentile by city calculator for 2019 in the United States. Enter pre-tax household or individual income earned between January and December 2018 to compare across any metro area in the United States.
Also try the income percentile by state calculator for a different view of income distribution.
Please read the discussion below on data quality and sample size.
Using the Income Percentile by City Calculator
The calculator is mostly self-explanatory, but there are a few quirks to consider as you look at the data. Note these elements carefully:
- First, choose to compare individual income or income earned by a household.
- Next, pick the closest city or metro area (you can search on state abbreviation)
- Optionally, add any other metro areas to the comparison area by clicking and typing
- Finally, read below for notes about the data quality for metro areas (especially smaller ones)
Income Percentile by City Tool Input Options
Here are the fine details on the metro area calculator:
- Income: Pre-tax income earned either by one individual or a household. Income is from any source on this list.
- Individual or Household: Choose whether you want to compare an individual income or household income
- City: The metro area where you would like to compare an income.
- Compare Cities: Optionally, add other metro areas to the comparison to see how an income would compare with the percentiles there.
Warning: Any city marked with ˟ lacks the data to show you income percentiles. Even then, the larger metros still are likely dubious - take a look at the number of samples in the tables when evaluating the data I show you.
Income Percentile by City Tool Output
There are two primary outputs:
- A visualization of income distribution in your selected city
- An estimated income percentile (in text)
The estimated percentile will use your choice of individual or household income by city.
Income Percentile by City Estimation
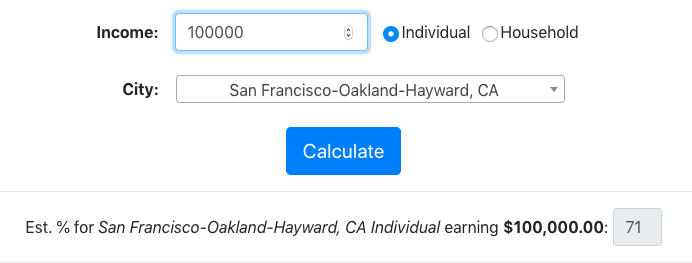
If you choose a primary city, income, and income type, DQYDJ will estimate the exact percentile for that total pre-tax income.
For cities with sufficient data, that will be to the nearest 1%. Sparse data means some cities will only be to the closest 10%.
Example:
Income Percentile by City Visualization
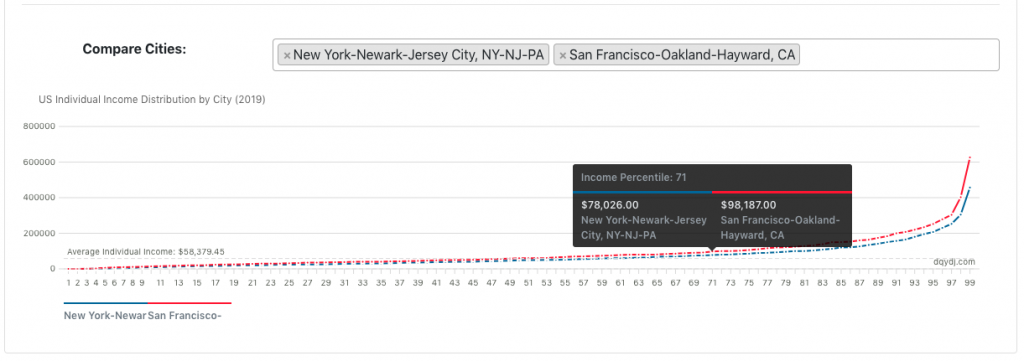
When you first enter the page, edit the comparison cities, or run a new percentile estimation we'll give you an income distribution graph. The income distribution will show percentiles from 1% - 99% in income (or deciles from 10% - 90% if a low-data metro is included.)
After running the comparison, we'll add a marker to the graph so you can see where it stacks up. If you hover over the graph you'll see the exact dollar break-point for a percentile.
Example:
Individual Income Percentile by City Statistics
Using the underlying data inside the calculator, here are tables with the summary statistics for individual income by city. We have average income by city, median income by city, population, number of workers, and some selected income brackets. Some cities have top 1% individual income by city data.
Household Income Percentile by City Statistics
Likewise, here are the summary statistics for household income by city. We have average income, median income, and some selected income brackets. We also have (a repeat) population, and number of households. Some cities have top 1% household income by city data.
Source and Methodology on the 2019 Income Percentile by City Calculator
Our source for the income percentile by city calculator was IPUMS-CPS:
Sarah Flood, Miriam King, Renae Rodgers, Steven Ruggles, and J. Robert Warren. Integrated Public Use Microdata Series, Current Population Survey: Version 6.0 [dataset]. Minneapolis, MN: IPUMS, 2019. https://doi.org/10.18128/D030.V6.0
For methodology on incomes and a definition of "worker" or individual, see the source articles:
- Average household income research. Read the definition of household from the Census Bureau.
- Average individual income research. Here I set up the screen for a worker.
Here is the additional data for cities:
- A city in our income definition is a metropolitan area defined by IPUMS.
- Income is all sources of income listed here.
In the calculator and tables data for some city income percentiles are 'missing'. These are the low data cities where we don't show income percentiles over 90% in the tool or table. We required a minimum of 250 households and 300 individuals to show centiles.
This data – even with my caveats – can be a bit dangerous. Here is the warning from the Census Bureau:
"One set of estimates that can be produced from CPS microdata files should be treated with caution. These are estimates for individual metropolitan areas. Although estimates for the larger areas such as New York, Los Angeles, and so forth, should be fairly accurate and valid for a multitude of uses, estimates for the smaller metropolitan areas (those with populations under 500,000) should be used with caution because of the relatively large sampling variability associated with these estimates."
Also, see the 2018 version of the tool.
My final disclaimer: All data above falls into the "business intelligence" category. Don't make major life decisions based upon the tool. Pull the data yourself and add whatever caveats you think you need.
