
In this post are United States Individual Income Brackets by Age for 2020. You'll also find average income by age, plus median and top 1% by age.
Individual incomes here are limited to Americans who worked (or wanted to work) in 2019. Incomes are gross – pre-tax – and earned between January and December 2019 (the survey is taken in March 2020, so income is pre-COVID-19).
We also have research on household incomes and individual incomes.
Individual Income Benchmarks by Age in 2020
Age is an excellent way to break down income comparisons – it's an excellent proxy for experience. While it's not always true, generally older folks will have more experience in a given field.
Over the entire economy we can make some reasonable assumptions based on the age data. One of the things we see: more experience also usually means more skill and a higher income.
And how can it help you, personally? When looking at income it's best to benchmark your earnings versus your peers instead of folks with more or less experience.
And – like with other breakdowns of the population – the best summary statistics of income are:
- Median income
- Average income
- Top 1% income
What is the median individual income by age in the United States?
These are the median incomes by age for 2020 in the United States for some selected ages:
- Age 25: $31,001
- Age 35: $50,800
- Age 45: $53,002
- Age 55: $54,510
- Age 65: $55,600
This following table has every age (18-75) plus median income in 2020 in the United States:
| Age | Median Income (2020) |
| 18 | $5,010.00 |
| 19 | $10,500.00 |
| 20 | $13,208.00 |
| 21 | $16,500.00 |
| 22 | $20,000.00 |
| 23 | $24,000.00 |
| 24 | $29,027.00 |
| 25 | $31,001.00 |
| 26 | $35,001.00 |
| 27 | $35,225.00 |
| 28 | $40,000.00 |
| 29 | $38,005.00 |
| 30 | $40,210.00 |
| 31 | $42,900.00 |
| 32 | $45,301.00 |
| 33 | $47,000.00 |
| 34 | $48,100.00 |
| 35 | $50,800.00 |
| 36 | $50,005.00 |
| 37 | $50,011.00 |
| 38 | $52,914.00 |
| 39 | $50,420.00 |
| 40 | $50,135.00 |
| 41 | $50,001.00 |
| 42 | $50,100.00 |
| 43 | $52,000.00 |
| 44 | $52,000.00 |
| 45 | $53,002.00 |
| 46 | $52,200.00 |
| 47 | $53,000.00 |
| 48 | $51,023.00 |
| 49 | $50,651.00 |
| 50 | $58,000.00 |
| 51 | $57,811.00 |
| 52 | $53,520.00 |
| 53 | $55,000.00 |
| 54 | $51,200.00 |
| 55 | $54,510.00 |
| 56 | $53,100.00 |
| 57 | $54,305.00 |
| 58 | $52,200.00 |
| 59 | $52,800.00 |
| 60 | $50,517.00 |
| 61 | $52,006.00 |
| 62 | $52,500.00 |
| 63 | $50,760.00 |
| 64 | $50,050.00 |
| 65 | $55,600.00 |
| 66 | $54,270.00 |
| 67 | $51,000.00 |
| 68 | $57,000.00 |
| 69 | $51,226.00 |
| 70 | $53,354.00 |
| 71 | $55,165.00 |
| 72 | $51,600.00 |
| 73 | $56,002.00 |
| 74 | $54,907.00 |
| 75 | $52,980.00 |
What is the average income by age in the United States?
Here are the 2020 average incomes by age for age 25 and ten year intervals:
- Age 25: $38,805.53
- Age 35: $70,756.02
- Age 45: $76,259.75
- Age 55: $80,704.96
- Age 65: $86,932.04
This table has every age (18-75) plus average income in 2020:
| Age | Average Income (2020) |
| 18 | $10,811.61 |
| 19 | $14,268.26 |
| 20 | $18,068.59 |
| 21 | $19,980.30 |
| 22 | $24,610.08 |
| 23 | $27,923.02 |
| 24 | $35,442.22 |
| 25 | $38,805.53 |
| 26 | $41,573.27 |
| 27 | $43,651.03 |
| 28 | $47,116.26 |
| 29 | $48,052.90 |
| 30 | $49,813.00 |
| 31 | $53,985.68 |
| 32 | $56,277.11 |
| 33 | $58,510.95 |
| 34 | $63,419.60 |
| 35 | $70,756.02 |
| 36 | $66,184.89 |
| 37 | $68,000.20 |
| 38 | $70,595.52 |
| 39 | $75,126.34 |
| 40 | $70,361.07 |
| 41 | $68,832.01 |
| 42 | $72,988.01 |
| 43 | $70,697.39 |
| 44 | $73,767.73 |
| 45 | $76,259.75 |
| 46 | $80,341.51 |
| 47 | $77,027.66 |
| 48 | $74,857.84 |
| 49 | $78,727.78 |
| 50 | $77,722.23 |
| 51 | $79,916.72 |
| 52 | $75,356.31 |
| 53 | $77,085.29 |
| 54 | $75,330.73 |
| 55 | $80,704.96 |
| 56 | $77,538.51 |
| 57 | $76,589.06 |
| 58 | $80,139.46 |
| 59 | $80,049.82 |
| 60 | $76,205.24 |
| 61 | $74,589.16 |
| 62 | $79,062.50 |
| 63 | $76,812.37 |
| 64 | $80,326.20 |
| 65 | $86,932.04 |
| 66 | $74,346.57 |
| 67 | $79,212.00 |
| 68 | $81,059.23 |
| 69 | $79,342.86 |
| 70 | $80,420.36 |
| 71 | $86,760.99 |
| 72 | $71,355.26 |
| 73 | $82,354.64 |
| 74 | $87,842.49 |
| 75 | $79,290.20 |
What is the top 1% individual income by age in the United States?
Here are the summary top 1% income benchmarks starting at 25 years old and moving up a decade at a time:
- Age 25: $151,101
- Age 35: $314,140
- Age 45: $463,560
- Age 55: $353,004
- Age 65: $391,000
Treat this data with more skepticism than the median and average. There are fewer high earners (by definition!) up here, so the numbers will jump around some. A good algorithm might be "look at a couple adjacent ages for a good feel of what the "actual" 1% might be."
That in mind, here is the chart for top 1% income by age in the United States in 2020:
| Age | Top 1% (2020) |
| 18 | $77,000.00 |
| 19 | $80,000.00 |
| 20 | $100,000.00 |
| 21 | $98,505.00 |
| 22 | $132,500.00 |
| 23 | $111,001.00 |
| 24 | $153,156.00 |
| 25 | $164,012.00 |
| 26 | $190,000.00 |
| 27 | $168,020.00 |
| 28 | $184,015.00 |
| 29 | $212,200.00 |
| 30 | $210,000.00 |
| 31 | $220,300.00 |
| 32 | $257,426.00 |
| 33 | $280,925.00 |
| 34 | $301,101.00 |
| 35 | $403,800.00 |
| 36 | $300,002.00 |
| 37 | $341,403.00 |
| 38 | $355,727.00 |
| 39 | $505,002.00 |
| 40 | $363,002.00 |
| 41 | $350,615.00 |
| 42 | $448,801.00 |
| 43 | $408,000.00 |
| 44 | $469,250.00 |
| 45 | $445,000.00 |
| 46 | $550,554.00 |
| 47 | $508,962.00 |
| 48 | $438,300.00 |
| 49 | $526,500.00 |
| 50 | $455,000.00 |
| 51 | $413,592.00 |
| 52 | $451,701.00 |
| 53 | $455,002.00 |
| 54 | $490,165.00 |
| 55 | $495,530.00 |
| 56 | $403,000.00 |
| 57 | $453,151.00 |
| 58 | $592,200.00 |
| 59 | $432,655.00 |
| 60 | $510,000.00 |
| 61 | $314,000.00 |
| 62 | $500,001.00 |
| 63 | $443,175.00 |
| 64 | $500,074.00 |
| 65 | $565,707.00 |
| 66 | $335,000.00 |
| 67 | $523,752.00 |
| 68 | $423,481.00 |
| 69 | $344,700.00 |
| 70 | $363,088.00 |
| 71 | $565,480.00 |
| 72 | $333,690.00 |
| 73 | $472,070.00 |
| 74 | $583,956.00 |
| 75 | $408,261.00 |
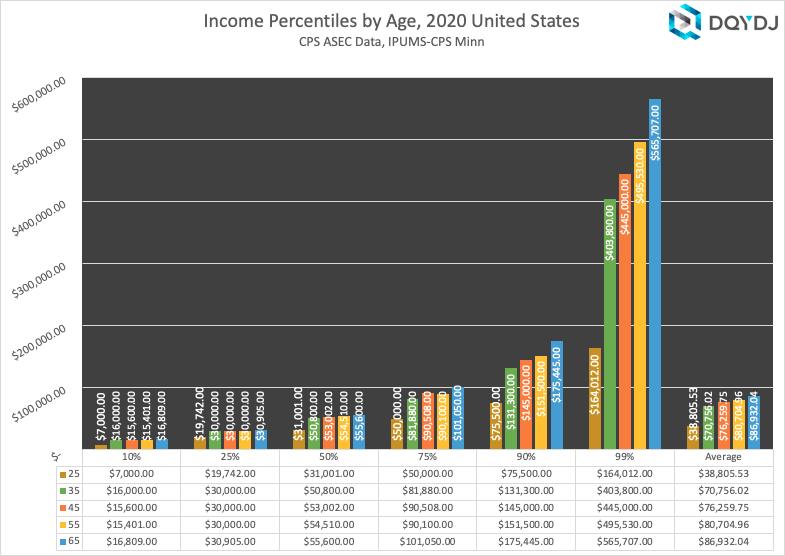
United States Individual Income Percentiles by Age
It's important to understand what I mean by income here. Income is all income earned by one individual. That includes:
- Wage income or earnings
- Business income
- Investment income
- Interest
- Other income (see the list of all components here)
If you only want to see salary, we have salary by age research too (and a calculator).
Income by Age Summary for the United States in 2020
It's hard to show all of this data at once – this table is a summary of various income quantiles versus every age 18-75 workers in the United States. (Scroll up for average)
| Age | 10% | 25% | 50% | 75% | 90% | 99% |
| 16 | $0.00 | $180.00 | $1,606.00 | $4,532.00 | $12,006.00 | $50,000.00 |
| 17 | $0.00 | $720.00 | $2,596.00 | $6,501.00 | $15,241.00 | $60,000.00 |
| 18 | $0.00 | $1,200.00 | $5,010.00 | $12,000.00 | $22,000.00 | $77,000.00 |
| 19 | $311.00 | $4,000.00 | $10,500.00 | $20,000.00 | $30,000.00 | $80,000.00 |
| 20 | $1,010.00 | $5,011.00 | $13,208.00 | $25,000.00 | $36,303.00 | $100,000.00 |
| 21 | $2,003.00 | $7,550.00 | $16,500.00 | $26,200.00 | $40,000.00 | $98,505.00 |
| 22 | $2,611.00 | $9,000.00 | $20,000.00 | $32,800.00 | $49,521.00 | $132,500.00 |
| 23 | $3,484.00 | $12,000.00 | $24,000.00 | $38,401.00 | $55,000.00 | $111,001.00 |
| 24 | $6,800.00 | $16,011.00 | $29,027.00 | $45,010.00 | $65,065.00 | $153,156.00 |
| 25 | $7,000.00 | $19,742.00 | $31,001.00 | $50,000.00 | $75,500.00 | $164,012.00 |
| 26 | $7,800.00 | $20,810.00 | $35,001.00 | $52,000.00 | $75,322.00 | $190,000.00 |
| 27 | $9,600.00 | $22,500.00 | $35,225.00 | $56,482.00 | $83,581.00 | $168,020.00 |
| 28 | $10,000.00 | $22,416.00 | $40,000.00 | $60,000.00 | $85,000.00 | $184,015.00 |
| 29 | $10,000.00 | $22,000.00 | $38,005.00 | $60,710.00 | $92,010.00 | $212,200.00 |
| 30 | $10,005.00 | $24,000.00 | $40,210.00 | $64,310.00 | $93,395.00 | $210,000.00 |
| 31 | $12,000.00 | $25,001.00 | $42,900.00 | $68,005.00 | $102,858.00 | $220,300.00 |
| 32 | $14,500.00 | $26,400.00 | $45,301.00 | $70,111.00 | $100,993.00 | $257,426.00 |
| 33 | $12,000.00 | $27,000.00 | $47,000.00 | $70,051.00 | $105,190.00 | $280,925.00 |
| 34 | $14,000.00 | $30,000.00 | $48,100.00 | $75,168.00 | $120,000.00 | $301,101.00 |
| 35 | $16,000.00 | $30,000.00 | $50,800.00 | $81,880.00 | $131,300.00 | $403,800.00 |
| 36 | $15,001.00 | $30,000.00 | $50,005.00 | $82,602.00 | $128,601.00 | $300,002.00 |
| 37 | $15,705.00 | $30,000.00 | $50,011.00 | $81,110.00 | $130,004.00 | $341,403.00 |
| 38 | $14,000.00 | $30,000.00 | $52,914.00 | $84,005.00 | $130,800.00 | $355,727.00 |
| 39 | $15,003.00 | $29,963.00 | $50,420.00 | $85,040.00 | $140,046.00 | $505,002.00 |
| 40 | $13,000.00 | $26,050.00 | $50,135.00 | $88,000.00 | $142,600.00 | $363,002.00 |
| 41 | $15,001.00 | $29,056.00 | $50,001.00 | $86,016.00 | $134,006.00 | $350,615.00 |
| 42 | $15,000.00 | $28,000.00 | $50,100.00 | $87,705.00 | $144,811.00 | $448,801.00 |
| 43 | $15,002.00 | $30,000.00 | $52,000.00 | $84,046.00 | $135,536.00 | $408,000.00 |
| 44 | $15,000.00 | $30,000.00 | $52,000.00 | $86,000.00 | $141,567.00 | $469,250.00 |
| 45 | $15,600.00 | $30,000.00 | $53,002.00 | $90,508.00 | $145,000.00 | $445,000.00 |
| 46 | $15,000.00 | $30,100.00 | $52,200.00 | $90,000.00 | $154,002.00 | $550,554.00 |
| 47 | $16,200.00 | $30,460.00 | $53,000.00 | $90,150.00 | $150,000.00 | $508,962.00 |
| 48 | $16,204.00 | $30,911.00 | $51,023.00 | $90,009.00 | $149,031.00 | $438,300.00 |
| 49 | $16,000.00 | $28,150.00 | $50,651.00 | $93,029.00 | $150,000.00 | $526,500.00 |
| 50 | $18,500.00 | $32,100.00 | $58,000.00 | $93,520.00 | $140,025.00 | $455,000.00 |
| 51 | $17,000.00 | $32,002.00 | $57,811.00 | $97,288.00 | $154,002.00 | $413,592.00 |
| 52 | $16,000.00 | $30,000.00 | $53,520.00 | $92,601.00 | $150,020.00 | $451,701.00 |
| 53 | $16,280.00 | $31,756.00 | $55,000.00 | $93,000.00 | $151,550.00 | $455,002.00 |
| 54 | $14,000.00 | $28,920.00 | $51,200.00 | $91,210.00 | $150,000.00 | $490,165.00 |
| 55 | $15,401.00 | $30,000.00 | $54,510.00 | $90,100.00 | $151,500.00 | $495,530.00 |
| 56 | $18,000.00 | $30,000.00 | $53,100.00 | $96,002.00 | $151,010.00 | $403,000.00 |
| 57 | $16,224.00 | $30,002.00 | $54,305.00 | $90,250.00 | $150,145.00 | $453,151.00 |
| 58 | $17,000.00 | $31,510.00 | $52,200.00 | $90,010.00 | $156,205.00 | $592,200.00 |
| 59 | $15,054.00 | $30,000.00 | $52,800.00 | $90,768.00 | $170,600.00 | $432,655.00 |
| 60 | $14,000.00 | $29,232.00 | $50,517.00 | $89,200.00 | $155,001.00 | $510,000.00 |
| 61 | $16,151.00 | $30,000.00 | $52,006.00 | $90,300.00 | $151,500.00 | $314,000.00 |
| 62 | $16,000.00 | $30,004.00 | $52,500.00 | $90,203.00 | $152,718.00 | $500,001.00 |
| 63 | $15,002.00 | $30,000.00 | $50,760.00 | $90,063.00 | $157,995.00 | $443,175.00 |
| 64 | $15,400.00 | $29,232.00 | $50,050.00 | $91,320.00 | $167,000.00 | $500,074.00 |
| 65 | $16,809.00 | $30,905.00 | $55,600.00 | $101,050.00 | $175,445.00 | $565,707.00 |
| 66 | $18,561.00 | $31,905.00 | $54,270.00 | $89,122.00 | $147,034.00 | $335,000.00 |
| 67 | $18,640.00 | $32,340.00 | $51,000.00 | $90,636.00 | $155,110.00 | $523,752.00 |
| 68 | $20,337.00 | $31,245.00 | $57,000.00 | $97,113.00 | $159,268.00 | $423,481.00 |
| 69 | $19,551.00 | $31,936.00 | $51,226.00 | $97,092.00 | $160,870.00 | $344,700.00 |
| 70 | $19,476.00 | $32,200.00 | $53,354.00 | $89,260.00 | $160,000.00 | $363,088.00 |
| 71 | $16,864.00 | $30,750.00 | $55,165.00 | $102,174.00 | $182,349.00 | $565,480.00 |
| 72 | $20,226.00 | $30,000.00 | $51,600.00 | $82,846.00 | $154,177.00 | $333,690.00 |
| 73 | $20,000.00 | $30,999.00 | $56,002.00 | $91,853.00 | $164,035.00 | $472,070.00 |
| 74 | $16,099.00 | $30,002.00 | $54,907.00 | $87,000.00 | $174,550.00 | $583,956.00 |
| 75 | $17,516.00 | $28,032.00 | $52,980.00 | $89,861.00 | $184,511.00 | $408,261.00 |
I'm not holding back on you on purpose – I want to make sure you can get every point if you wish! Use the income percentile by age calculator to see this data at its full resolution.
Methodology on 2020 United States Age & Income Brackets
This data comes from the United States Census Bureau's Annual ASEC survey. It was released in September 2020.
I then use harmonized data from the University of Minnesota's Minnesota Population Center in R. Citation:
Sarah Flood, Miriam King, Renae Rodgers, Steven Ruggles and J. Robert Warren. Integrated Public Use Microdata Series, Current Population Survey: Version 7.0 [dataset]. Minneapolis, MN: IPUMS, 2020. https://doi.org/10.18128/D030.V7.0
What is your 'worker' screen?
The full worker screen methodology is in the individual income brackets post.
How is the data quality on the income by age data?
As always, thank you for asking – I ask that you be skeptical of the top few percentiles for each age.
Income is relatively well-behaved for the majority of the income curve. However, people at the top generate income from income sources with more volatility: investments, businesses, and so on. The entire individual income data comes from 82,990 samples – which is good for a larger group, but riskier for some ages. As you'll see in a second, especially for age 70+: it's tricky.
To get a sense of the "actual top 1% income" for an age, look at the surrounding years to get a better feel for the data.
As I like to say: this data is excellent for business intelligence needs. Be skeptical about the exact boundary between percentiles. It's close, but you do need to embrace some ambiguity.
Income data points and workers by age in 2020
As for the actual number of data points per age, here's the exhaustive list for you to make a reasoned call. There are two numbers:
- The samples or number of "data points", or the actual number of people in the survey
- The estimated workforce that those data points represent (based on the survey weightings)
| Age | Samples | Estimated Workforce |
| 16 | 602 | 1,064,718 |
| 17 | 912 | 1,667,642 |
| 18 | 1239 | 2,282,885 |
| 19 | 1140 | 2,383,463 |
| 20 | 1208 | 2,907,334 |
| 21 | 1225 | 3,019,184 |
| 22 | 1400 | 3,611,073 |
| 23 | 1332 | 3,368,611 |
| 24 | 1376 | 3,602,967 |
| 25 | 1549 | 4,115,495 |
| 26 | 1457 | 3,804,042 |
| 27 | 1579 | 4,030,764 |
| 28 | 1602 | 3,972,302 |
| 29 | 1694 | 4,206,545 |
| 30 | 1747 | 4,006,745 |
| 31 | 1763 | 3,892,810 |
| 32 | 1844 | 3,923,484 |
| 33 | 1815 | 3,825,709 |
| 34 | 1830 | 3,692,093 |
| 35 | 1980 | 3,832,441 |
| 36 | 1858 | 3,582,407 |
| 37 | 2074 | 3,928,880 |
| 38 | 1915 | 3,522,998 |
| 39 | 1958 | 3,824,990 |
| 40 | 1907 | 3,655,919 |
| 41 | 1795 | 3,359,907 |
| 42 | 1706 | 3,274,173 |
| 43 | 1750 | 3,364,944 |
| 44 | 1737 | 3,302,261 |
| 45 | 1777 | 3,371,940 |
| 46 | 1696 | 3,295,997 |
| 47 | 1670 | 3,253,179 |
| 48 | 1638 | 3,335,498 |
| 49 | 1779 | 3,640,392 |
| 50 | 1767 | 3,570,605 |
| 51 | 1735 | 3,498,733 |
| 52 | 1602 | 3,305,033 |
| 53 | 1539 | 3,206,420 |
| 54 | 1566 | 3,261,899 |
| 55 | 1605 | 3,407,525 |
| 56 | 1621 | 3,399,250 |
| 57 | 1514 | 3,282,950 |
| 58 | 1453 | 3,091,756 |
| 59 | 1445 | 3,120,313 |
| 60 | 1379 | 3,093,804 |
| 61 | 1337 | 2,887,728 |
| 62 | 1275 | 2,807,148 |
| 63 | 1172 | 2,580,737 |
| 64 | 1044 | 2,250,144 |
| 65 | 934 | 1,969,961 |
| 66 | 757 | 1,572,570 |
| 67 | 701 | 1,503,989 |
| 68 | 561 | 1,209,388 |
| 69 | 501 | 1,063,699 |
| 70 | 437 | 897,715 |
| 71 | 357 | 746,256 |
| 72 | 367 | 764,092 |
| 73 | 293 | 614,258 |
| 74 | 226 | 465,359 |
| 75 | 208 | 469,282 |
Is individual income gross or net?
All income by age numbers in this post are gross income, or before tax. If you are comparing an income make sure it is before any tax is taken out.
Analysis of Individual Income by Age Brackets in 2020
This is one of my favorite posts to produce – along with the companion income percentile by age calculator. While even dividing by age isn't perfect, it does help us avoid some of the effects of shifting demographics in the workforce. (See the Simpson's Paradox).
