
Below are estimated United States salary brackets for 2020 (using the newest data we have through mid-2021). See estimates for the average, median, and top 1% wage or salary in the United States.
(Salaries are earned between January and December 2019.)
Salary Benchmarks in 2020
The most popular salary statistics to compare are:
- Median salary
- Average salary
- Top 1% salary
Of these, the median salary is the most important – even though it is the smallest of the three. It demarcates the salary where half of all workers make more, and half make less.
What is the median salary?
The median salary in the United States in 2020 was $47,000.
What is the average salary?
In 2020, the average salary in the United States was $63,409.41.
What is the top 1% salary?
$320,000 was the threshold to earn a top 1% salary in 2020.
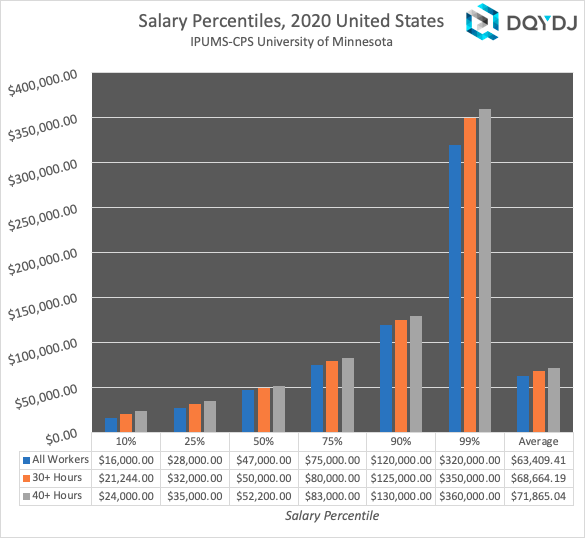
Salary Percentiles for the United States in 2020
Summaries are nice – but a complete view is better. Below is a chart summarizing every salary percentile in 2020... and the average for the category you're interested in viewing.
The additional columns limit workers to only those who 'typically' work 30 hours a week, or 40 hours a week or more, respectively. This allows you to adjust for your definition of 'full-time.'
| All Workers | 30+ Hours | 40+ Hours | |
| 1% | $3,500.00 | $7,500.00 | $9,500.00 |
| 2% | $6,000.00 | $10,800.00 | $12,000.00 |
| 3% | $8,000.00 | $13,000.00 | $15,000.00 |
| 4% | $10,000.00 | $15,000.00 | $17,000.00 |
| 5% | $10,800.00 | $16,000.00 | $19,000.00 |
| 6% | $12,000.00 | $18,000.00 | $20,000.00 |
| 7% | $13,000.00 | $19,000.00 | $20,000.00 |
| 8% | $14,500.00 | $20,000.00 | $22,000.00 |
| 9% | $15,000.00 | $20,000.00 | $23,000.00 |
| 10% | $16,000.00 | $21,244.00 | $24,000.00 |
| 11% | $17,300.00 | $22,303.00 | $25,000.00 |
| 12% | $18,000.00 | $23,783.00 | $25,000.00 |
| 13% | $20,000.00 | $24,000.00 | $25,250.00 |
| 14% | $20,000.00 | $25,000.00 | $26,400.00 |
| 15% | $20,000.00 | $25,000.00 | $28,000.00 |
| 16% | $21,000.00 | $25,812.00 | $28,600.00 |
| 17% | $22,000.00 | $26,685.00 | $30,000.00 |
| 18% | $23,000.00 | $28,000.00 | $30,000.00 |
| 19% | $24,000.00 | $28,000.00 | $30,000.00 |
| 20% | $25,000.00 | $30,000.00 | $30,000.00 |
| 21% | $25,000.00 | $30,000.00 | $31,200.00 |
| 22% | $25,000.00 | $30,000.00 | $32,000.00 |
| 23% | $26,000.00 | $30,000.00 | $33,000.00 |
| 24% | $27,000.00 | $31,000.00 | $34,000.00 |
| 25% | $28,000.00 | $32,000.00 | $35,000.00 |
| 26% | $29,000.00 | $33,000.00 | $35,000.00 |
| 27% | $30,000.00 | $34,000.00 | $35,600.00 |
| 28% | $30,000.00 | $35,000.00 | $36,000.00 |
| 29% | $30,000.00 | $35,000.00 | $37,440.00 |
| 30% | $30,002.00 | $35,000.00 | $38,000.00 |
| 31% | $32,000.00 | $36,000.00 | $40,000.00 |
| 32% | $32,000.00 | $37,000.00 | $40,000.00 |
| 33% | $33,800.00 | $38,000.00 | $40,000.00 |
| 34% | $35,000.00 | $39,000.00 | $40,000.00 |
| 35% | $35,000.00 | $40,000.00 | $41,000.00 |
| 36% | $35,000.00 | $40,000.00 | $42,000.00 |
| 37% | $36,000.00 | $40,000.00 | $43,000.00 |
| 38% | $37,000.00 | $40,900.00 | $45,000.00 |
| 39% | $38,000.00 | $42,000.00 | $45,000.00 |
| 40% | $39,500.00 | $43,000.00 | $45,000.00 |
| 41% | $40,000.00 | $44,000.00 | $46,000.00 |
| 42% | $40,000.00 | $45,000.00 | $47,500.00 |
| 43% | $40,000.00 | $45,000.00 | $48,000.00 |
| 44% | $41,000.00 | $46,000.00 | $49,100.00 |
| 45% | $42,000.00 | $47,000.00 | $50,000.00 |
| 46% | $43,500.00 | $48,000.00 | $50,000.00 |
| 47% | $45,000.00 | $49,275.00 | $50,000.00 |
| 48% | $45,000.00 | $50,000.00 | $50,000.00 |
| 49% | $45,707.00 | $50,000.00 | $52,000.00 |
| 50% | $47,000.00 | $50,000.00 | $52,200.00 |
| 51% | $48,000.00 | $50,000.00 | $54,000.00 |
| 52% | $49,900.00 | $52,000.00 | $55,000.00 |
| 53% | $50,000.00 | $53,000.00 | $55,000.00 |
| 54% | $50,000.00 | $54,080.00 | $56,000.00 |
| 55% | $50,000.00 | $55,000.00 | $58,000.00 |
| 56% | $51,000.00 | $55,000.00 | $60,000.00 |
| 57% | $52,000.00 | $57,000.00 | $60,000.00 |
| 58% | $54,000.00 | $58,000.00 | $60,000.00 |
| 59% | $55,000.00 | $60,000.00 | $60,000.00 |
| 60% | $55,000.00 | $60,000.00 | $61,000.00 |
| 61% | $56,350.00 | $60,000.00 | $63,000.00 |
| 62% | $58,000.00 | $60,000.00 | $65,000.00 |
| 63% | $60,000.00 | $62,000.00 | $65,000.00 |
| 64% | $60,000.00 | $65,000.00 | $67,000.00 |
| 65% | $60,000.00 | $65,000.00 | $69,000.00 |
| 66% | $60,790.00 | $66,000.00 | $70,000.00 |
| 67% | $63,000.00 | $68,000.00 | $70,000.00 |
| 68% | $65,000.00 | $70,000.00 | $72,000.00 |
| 69% | $65,000.00 | $70,000.00 | $74,106.00 |
| 70% | $68,000.00 | $72,000.00 | $75,000.00 |
| 71% | $70,000.00 | $74,000.00 | $75,000.00 |
| 72% | $70,000.00 | $75,000.00 | $78,000.00 |
| 73% | $72,000.00 | $75,000.00 | $80,000.00 |
| 74% | $74,000.00 | $78,917.00 | $80,000.00 |
| 75% | $75,000.00 | $80,000.00 | $83,000.00 |
| 76% | $76,000.00 | $80,000.00 | $85,000.00 |
| 77% | $80,000.00 | $84,000.00 | $86,000.00 |
| 78% | $80,000.00 | $85,000.00 | $90,000.00 |
| 79% | $82,000.00 | $88,000.00 | $90,000.00 |
| 80% | $85,000.00 | $90,000.00 | $95,000.00 |
| 81% | $87,000.00 | $92,000.00 | $97,000.00 |
| 82% | $90,000.00 | $95,000.00 | $100,000.00 |
| 83% | $92,000.00 | $100,000.00 | $100,000.00 |
| 84% | $96,000.00 | $100,000.00 | $101,250.00 |
| 85% | $100,000.00 | $100,000.00 | $105,500.00 |
| 86% | $100,000.00 | $105,000.00 | $110,000.00 |
| 87% | $103,000.00 | $110,000.00 | $115,000.00 |
| 88% | $110,000.00 | $115,000.00 | $120,000.00 |
| 89% | $114,728.00 | $120,000.00 | $123,000.00 |
| 90% | $120,000.00 | $125,000.00 | $130,000.00 |
| 91% | $125,000.00 | $130,000.00 | $134,000.00 |
| 92% | $130,000.00 | $137,000.00 | $143,000.00 |
| 93% | $140,000.00 | $148,837.00 | $150,000.00 |
| 94% | $150,000.00 | $150,000.00 | $155,000.00 |
| 95% | $155,000.00 | $164,000.00 | $170,000.00 |
| 96% | $175,000.00 | $180,000.00 | $189,000.00 |
| 97% | $200,000.00 | $200,000.00 | $204,000.00 |
| 98% | $235,000.00 | $250,000.00 | $250,000.00 |
| 99% | $320,000.00 | $350,000.00 | $360,000.00 |
| Average | $63,409.41 | $68,664.19 | $71,865.04 |
The dollar amount is the "threshold" of brackets or the breakpoint between them.
Salary vs. Income
Salary is the amount of money someone is paid in wages at a job. However, it's only one element of income.
Many people earn money through other means – everything from rentals, investments, to interest, to farms and businesses. Adding up all of those categories leads to income, a better view of spending power than merely looking at a salary. Find our income posts here. (Including household income and individual income).
Methodology on 2020 United States Salary Brackets
Data comes from the United States Census Bureau's Annual ASEC survey, released in September 2020. Here are the criteria I apply:
- AGE >= 16
- CLASSWKR >= 20 and CLASSWKR <= 28
- WKSWORK1 at least 40 weeks
- WORKLY is 2, or the person 'wants' a job
Additionally, the two other categories of full-time workers set the respective floor on hours worked. For all columns, you're only seeing INCWAGE – wage and salary income.
If someone manages to have multiple W-2 jobs both will be included (although the full-time columns mean one job is at least 30 or 40 hours per week). We also broke down salary by age.
Sarah Flood, Miriam King, Renae Rodgers, Steven Ruggles and J. Robert Warren. Integrated Public Use Microdata Series, Current Population Survey: Version 8.0 [dataset]. Minneapolis, MN: IPUMS, 2020. https://doi.org/10.18128/D030.V8.0
How many samples are in the 2020 data?
- All salary earners: 60,951 data points (est. 129,295,408 Americans)
- 30+ Hours: 50,544 data points (est. 107,308,589 Americans)
- 40+ Hours: 45,064 data points (est. 95,629,477 Americans)
Is this salary gross or net? Does this data include taxes?
The salary data in this post is before tax or gross salary.
