
Below, you can find United States average individual income by education and median individual income by education in 2020. Also find the top 1% and individual income percentiles by education.
Find the statistics for people with education attainment ending in (or ending in 'a'):
- Grades 1, 2, 3, or 4
- Grades 5 or 6
- Grades 7 or 8
- Grade 9
- Grade 10
- Grade 11
- 12th grade, no diploma
- High school diploma or equivalent
- Some college but no degree
- Associate's degree, occupational/vocational program
- Associate's degree, academic program
- Bachelor's degree
- Master's degree
- Professional school degree
- Doctorate degree
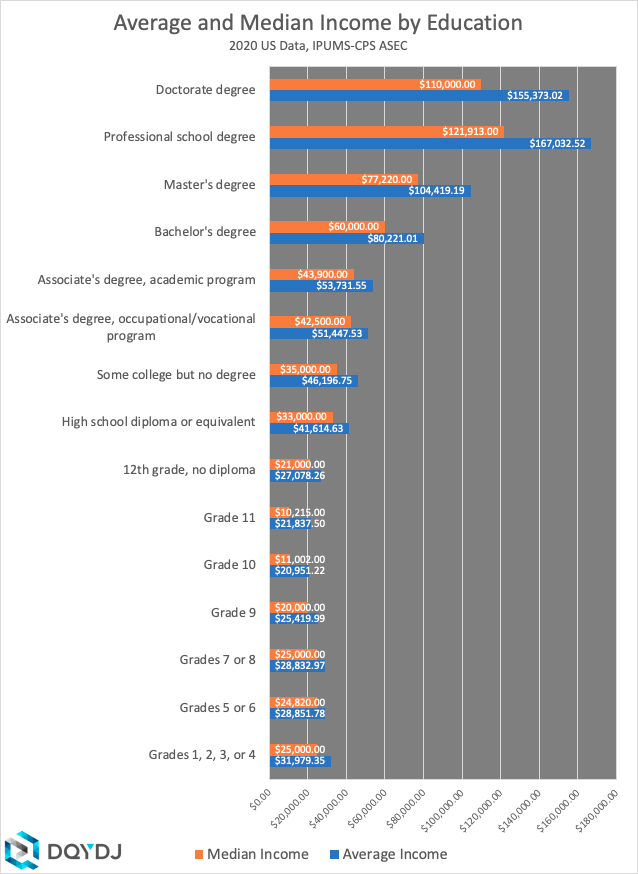
Average and Median Income by Education
As you'd expect, income isn't just a function of experience (or a proxy such as age). Training – especially as measured by educational achievement – also affects a worker's income. And for the most part, more education leads to more income.
And while these comparisons aren't perfect – they aren't age-matched, they don't account for years in the workforce, etc. – they provide a pretty good hint at how education affects income.
In 2020 in the United States, the average individual income was $62,518.13. The median individual income was $43,206.00.
For every educational achievement category*, here is the average, median, and top 1% percentile income:
| Average Income | Median Income | Top 1% Income | |
| Grades 1, 2, 3, or 4 | $31,979.35 | $25,000.00 | $150,901.00 |
| Grades 5 or 6 | $28,851.78 | $24,820.00 | $120,508.00 |
| Grades 7 or 8 | $28,832.97 | $25,000.00 | $129,201.00 |
| Grade 9 | $25,419.99 | $20,000.00 | $115,100.00 |
| Grade 10 | $20,951.22 | $11,002.00 | $140,185.00 |
| Grade 11 | $21,837.50 | $10,215.00 | $165,000.00 |
| 12th grade, no diploma | $27,078.26 | $21,000.00 | $122,796.00 |
| High school diploma or equivalent | $41,614.63 | $33,000.00 | $181,575.00 |
| Some college but no degree | $46,196.75 | $35,000.00 | $219,057.00 |
| Associate's degree, occupational/vocational program | $51,447.53 | $42,500.00 | $200,205.00 |
| Associate's degree, academic program | $53,731.55 | $43,900.00 | $216,010.00 |
| Bachelor's degree | $80,221.01 | $60,000.00 | $415,751.00 |
| Master's degree | $104,419.19 | $77,220.00 | $701,500.00 |
| Professional school degree | $167,032.52 | $121,913.00 | $876,023.00 |
| Doctorate degree | $155,373.02 | $110,000.00 | $930,566.00 |
*Read these as "highest educational achievement". For example, "Doctorate Degree" means graduated with a degree, not only pursued.
What's going on with the median income for less than high school achievement?
I don't know – but to hazard a guess, those who finish in 10th and 11th grade might include many high school drop outs. Those who end in 9th grade, on the other hand, may have planned their departure.
This is conjecture though – note the median incomes are better behaved after high school.
Income by Education Visualization, Comparison, and Tool
Below is a calculator for income percentile by education. Unlike the above summary statistics, it includes every income percentile for each group. Enter an income plus an education achievement to see where that income would rank for an educational cohort.
Additionally, you can use the chart to overlay multiple educational groups. That way you can visually see how the income percentiles align for each group.
Income Percentile by Education Methodology
This data uses 2020 IPUMS-CPS data to calculate incomes versus educational achievement. See the income percentile calculator for more details and my description of the worker screen. You can find the deeper explanation of education here.
Sarah Flood, Miriam King, Renae Rodgers, Steven Ruggles and J. Robert Warren. Integrated Public Use Microdata Series, Current Population Survey: Version 8.0 [dataset]. Minneapolis, MN: IPUMS, 2020.
https://doi.org/10.18128/D030.V8.0
Workforce Size by Educational Achievement
Remember, these estimates are based off a (very large) survey, but we do lose some of the accuracy of the estimates when splitting in this manner. Unlike in some other posts (like income by race), groups are still relatively large here – but be careful, especially in the top 2-3% incomes.
| Estimated Workers FY '19 | Samples | |
| Grades 1, 2, 3, or 4 | 649,015 | 341 |
| Grades 5 or 6 | 1,570,288 | 788 |
| Grades 7 or 8 | 1,492,130 | 745 |
| Grade 9 | 2,027,471 | 1,039 |
| Grade 10 | 2,686,902 | 1,352 |
| Grade 11 | 3,747,979 | 1,958 |
| 12th grade, no diploma | 2,337,093 | 1,118 |
| High school diploma or equivalent | 44,737,297 | 20,951 |
| Some college but no degree | 29,914,926 | 14,074 |
| Associate's degree, occupational/vocational program | 7,818,836 | 3,826 |
| Associate's degree, academic program | 10,904,111 | 5,195 |
| Bachelor's degree | 43,344,320 | 19,647 |
| Master's degree | 18,249,369 | 8,684 |
| Professional school degree | 2,698,931 | 1,316 |
| Doctorate degree | 3,720,311 | 1,826 |
