
On this page you'll find United States average individual income by race and ethnicity and median individual income by race and ethnicity in 2020. You'll also find the top 1% individual income by race and ethnicity and an income by race and ethnicity calculator and visualization.
The calculator will allow you to look up the income percentile of a pre-tax income in 2020 (Jan - Dec 2019 – the newest data we have in mid-2021) to compare. You can also optionally plot multiple races and ethnicities in the tool to visualize income inequality by race.
We have statistics for:
- White Non-Hispanic
- Hispanic or Latino of any Race
- Black
- Asian
- American Indian
- Pacific Islander
- Two or More Races
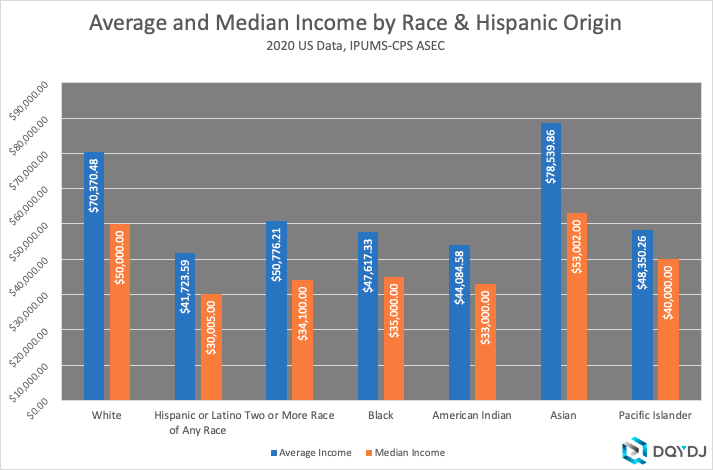
Average and Median Income by Race
In America, Asian workers made the highest average individual income at $78,539.86, while Hispanic or Latino workers of any race made the least at $41,723.59.
What was the average income for White Non-Hispanic workers?
The average White Non-Hispanic worker made $70,370.48. Their median income was $50,000.00.
What was the average income for workers who are Hispanic or Latino of any race?
The average Hispanic or Latino worker of any race made $41,723.59. They made a median income of $30,005.00.
What was the Black average income?
An average Black worker made $47,617.33. The Black median income was $35,000.00.
How much did the average Asian worker make?
The average Asian worker made $78,539.86. The Asian median income was $53,002.00.
How much did the average Pacific Islander make?
An average Pacific Islander worker made $48,350.26. The Pacific Islander median income was $40,000.00.
How much did the average American Indian make?
The average American Indian worker made $44,084.58. The American Indian median income was $33,000.00.
Top One Percent Income by Race and Hispanic Origin
Overall in the United States, the top one percent of all workers made $361,020.00. Divided to races and ethnicities the top one percent income by race varied quite a bit.
The highest top one percent income was Asian at $500,228.00. The lowest top 1% earners were American Indian workers at $183,350.00.
Note: income is not a perfectly behaved data set. Especially for smaller numbers of samples you should be dubious the top 1% is exact. In the methodology we've listed the number of samples in the survey for you to judge the reliability of these numbers.
What was the top one percent income for White Non-Hispanic workers?
A top one percent White Non-Hispanic worker's income started at $420,376.00
What was the top one percent income for workers who are Hispanic or Latino of any race?
A top one percent Hispanic or Latino worker of any race made $212,001.00.
What was the Black top one percent income?
A top one percent Black worker made $250,003.00.
How much did a top one percent Asian worker make?
A top one percent Asian worker made $500,228.00.
How much did a top one percent Pacific Islander worker make?
A top one percent Pacific Islander worker made $200,320.00.
What was the American Indian top one percent income?
A top one percent American Indian worker made $183,350.00.
Race and Ethnicity Income Visualization, Comparison, and Tool
Below is a calculator for income percentile by race and ethnicity. Enter a race or ethnicity and an income earned in full-year 2019, and we'll plot it against other earners in the same cohort. Additionally, you can visualize income inequality by race by adjusting the comparison field.
Income Percentile by Race and Ethnicity Methodology
This data uses 2020 IPUMS-CPS data to calculate incomes. See the income percentile calculator for more details and a description of my "worker" screen.
Sarah Flood, Miriam King, Renae Rodgers, Steven Ruggles and J. Robert Warren. Integrated Public Use Microdata Series, Current Population Survey: Version 8.0 [dataset]. Minneapolis, MN: IPUMS, 2020.
https://doi.org/10.18128/D030.V8.0
Workforce Size by Race
These calculations estimate the workforce size by race, and well as give you the number of samples for race & ethnicity in the 2020 ASEC. You can use the sample size to judge how accurate the top 1% data may be.
| Race or Ethnicity | Samples | Estimated Workers |
| White | 50,831 | 108,432,960 |
| Hispanic or Latino of Any Race | 15,342 | 31,458,274 |
| Two or More Race | 1,412 | 2,863,658 |
| Black | 8,565 | 20,822,783 |
| American Indian | 856 | 1,135,523 |
| Asian | 5,617 | 10,947,022 |
| Pacific Islander | 367 | 554,087 |
Interested in past data? Find previous editions here:
